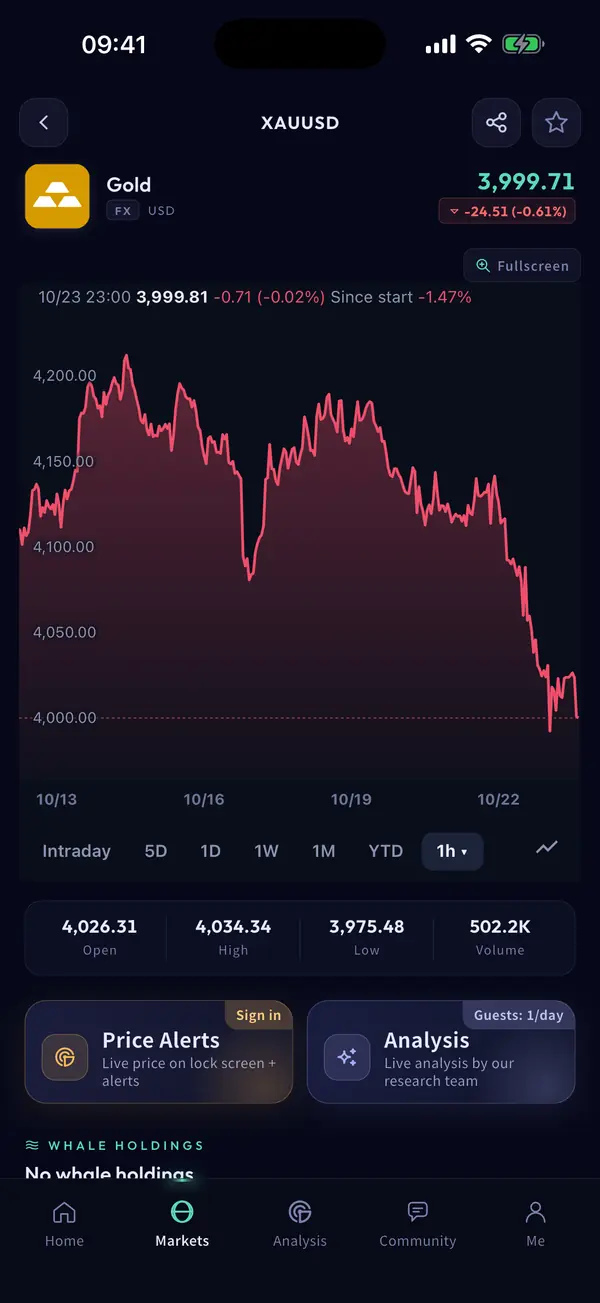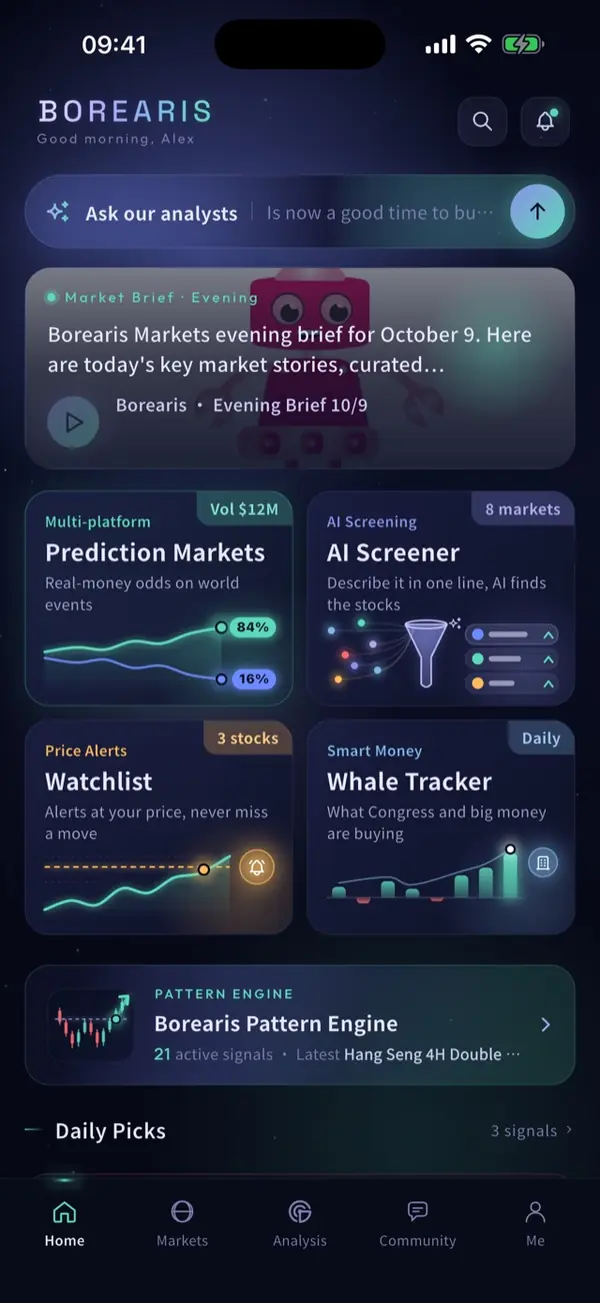

BOREARIS
Gold 4,030.44 -0.80% S&P 500 7,730.7 +0.00% EUR/USD 1.11184 -0.07% Bitcoin 80,794.4 -0.00% USD/JPY 157.851 -0.09% Hang Seng 23,044.0 -0.13% GBP/USD 1.32898 -0.12% Silver 53.847 -1.14% Ethereum 2,348.10 +0.04% Dollar Index 102.241 +0.13% AUD/USD 0.70320 +0.04% USD/CNH 6.6662 +0.02%
BOREARIS RESEARCH · UPDATED EVERY 30 MIN

Your AI trading assistant.
Every market, one app.

Short-term signals, swing signals, key levels and market briefings across global markets: forex, metals, indices, commodities, crypto and stocks, continuously updated, with every result made public. You make the call.


Download on the App Store Get it on Google Play
Scan to downloadiOS・Android
  • Global markets
  • Every 30 min
  • 6 languages
  • Public signal results
GLOBAL MARKET PULSE · SHORT-TERM PICKS
MARKET PULSE

Global markets,
see what is moving

Each band of light is one market; longer strands mean more room to move. The tags are selected recent 30-minute short-term signals with their actual results, refreshed every 30 minutes; the full record is published on the short-term signals page.

Hover over the ring to see the view for any market.Tap the ring to see the view for a market.

Globalmarket coverageForex, metals, indices, commodities, crypto, stocks
48updates a daySignals and key levels refreshed every 30 minutes
73%top win rate, short-term signals*Best-performing asset classes in a two-year backtest, after spreads
73%of swing signals profitable*Backtest, 1,668 signals, after spreads
MARKETS TODAY

Today's trade signals and levels

73%Top win rate (best asset classes)
2,501Signals in a two-year backtest
+0.20RAverage per signal, after spreads
22/24Months profitable

No active short-term signals right now; below are the most recent closed ones. About 4.6 per trading day on average; on weekends only crypto produces signals.

30-minute chart, held from a few hours to a day. R = the risk taken on each signal (entry to stop). Past results do not guarantee future performance. All short-term signals
Today's bias: 64 Bullish・28 Bearish
Gold30 min 4,030.44
Expected move 2.11%
Targets 1 · 24,096.82 / 4,115.48
Pivot4,028.03
Updated 10-28 14:03Set an alert
EUR/USD30 min 1.11184
Expected move 32–43 pips
Targets 1 · 21.11500 / 1.11618
Pivot1.11040
Updated 10-28 14:03Set an alert
S&P 50030 min 7,730.7
Expected move 0.69%
Targets 1 · 27,765.7 / 7,784.2
Pivot7,692.0
Updated 10-28 14:03Set an alert
Bitcoin30 min 80,794.4
Expected move 1.97%
Targets 1 · 281,961.5 / 82,382.8
Pivot80,387.2
Updated 10-28 14:03Set an alert
Nasdaq 10030 min 29,804.7
Expected move 1.27%
Targets 1 · 230,044.1 / 30,181.9
Pivot29,544.8
Updated 10-28 14:03Set an alert
USD/JPY30 min 157.851
Expected move 22–45 pips
Targets 1 · 2158.068 / 158.302
Pivot157.187
Updated 10-28 14:03Set an alert
GoldDaily 4,030.44
Expected move 9.78%
Targets 1 · 23,799.26 / 3,636.17
Pivot4,446.08
Updated 10-28 14:03Set an alert
EUR/USDDaily 1.11184
Expected move 92–172 pips
Targets 1 · 21.10269 / 1.09461
Pivot1.13504
Updated 10-28 14:03Set an alert
S&P 500Daily 7,730.7
Expected move 4.34%
Targets 1 · 27,966.5 / 8,066.4
Pivot7,574.1
Updated 10-28 14:03Set an alert
BitcoinDaily 80,794.4
Expected move 7.43%
Targets 1 · 276,420.2 / 74,790.8
Pivot83,101.2
Updated 10-28 14:03Set an alert
Nasdaq 100Daily 29,804.7
Expected move 7.44%
Targets 1 · 228,089.6 / 27,587.7
Pivot30,725.7
Updated 10-28 14:03Set an alert
USD/JPYDaily 157.851
Expected move 551–777 pips
Targets 1 · 2163.364 / 165.621
Pivot154.005
Updated 10-28 14:03Set an alert
Expected move = distance from the current price to targets 1 and 2; pips for forex, percent for everything else. All markets
89%Top win rate · NZD/USD (28)
73%Profitable · 1,668 backtested
+0.17RAverage per signal, after spreads
72%Last 6 months on live quotes · 515
LongOpen

USD/CNH 4H swing signal: bullish, go long

  • Signal issued Oct 28, 2026 08:00 (UTC+8, Asian session); valid: Up to about 10 trading days.
  • Price change since the signal +0.10R (entry 6.66500, last 6.66611).
SignalTGT 6.677821/2 6.670296.66611ENT 6.66500SL 6.65443━ MA20 + Bollinger Bands ━ MA50 4H70503036.83━ RSI ━ 9MA-0.00━ MACD ━ MACD Signal10/13 08:0010/15 16:0010/19 20:0010/22 04:0010/26 08:00
SignalTGT6.677821/26.670296.66611ENT6.66500SL6.65443━ MA20 ━ MA5070503036.83━ RSI ━ 9MA-0.00━ MACD ━ MACD Signal22 16:0026 04:0027 20:00

Levels and risk

PriceFrom entryR
Target6.67782+128.2 pips+1.2R
Take half off6.67029+52.9 pips+0.5R
Entry6.66500base0R
Stop6.65443-105.7 pips-1.0R
Risk-reward1:1.2
Exit styleScale out
6.66611
StopTarget

What we see

  • The current key-level view for USD/CNH is bullish with the pivot at 6.66101, in line with this signal.
  • Swing Signals · Forex: backtest of 326 signals, 75% profitable, +0.14R each.
  • USD/CNH: backtest of 48 signals, 75% profitable, +0.04R each.
  • To follow it: split into two orders, take the first off at the take-half price, then move the second order's stop to entry. See the steps
SignalOct 28, 2026 08:00FilledOct 28, 2026 08:00
LongOpen

USD/SEK 4H swing signal: bullish, go long

  • Signal issued Oct 27, 2026 00:00 (UTC+8, US session); valid: Up to about 10 trading days.
  • Price change since the signal +0.00R (entry 9.95720, last 9.95735).
SignalTGT 10.058531/2 9.992549.95735ENT 9.95720SL 9.88652━ MA20 + Bollinger Bands ━ MA50 4H70503058.38━ RSI ━ 9MA00.01━ MACD ━ MACD Signal10/13 08:0010/15 16:0010/19 20:0010/22 04:0010/26 08:00
SignalTGT10.058531/29.992549.95735ENT9.95720SL9.88652━ MA20 ━ MA5070503058.38━ RSI ━ 9MA00.01━ MACD ━ MACD Signal22 16:0026 04:0027 20:00

Levels and risk

PriceFrom entryR
Target10.05853+1.02%+1.4R
Take half off9.99254+0.35%+0.5R
Entry9.95720base0R
Stop9.88652-0.71%-1.0R
Risk-reward1:1.4
Exit styleScale out
9.95735
StopTarget

What we see

  • Swing Signals · Forex: backtest of 326 signals, 75% profitable, +0.14R each.
  • USD/SEK: backtest of 55 signals, 69% profitable, +0.02R each.
  • To follow it: split into two orders, take the first off at the take-half price, then move the second order's stop to entry. See the steps
SignalOct 27, 2026 00:00FilledOct 27, 2026 00:00
ShortOpen

Microsoft 4H swing signal: bearish, go short

  • Signal issued Oct 24, 2026 00:00 (UTC+8, US session); valid: Up to about 10 trading days.
  • Price change since the signal -0.02R (entry 530.87, last 531.09).
SignalSL 540.99531.09ENT 530.871/2 525.80TGT 510.61━ MA20 + Bollinger Bands ━ MA50 4H70503052.22━ RSI ━ 9MA00.93━ MACD ━ MACD Signal09/09 20:0009/18 20:0009/29 20:0010/08 20:0010/19 20:00
SignalSL540.99531.09ENT530.871/2525.80TGT510.61━ MA20 ━ MA5070503052.22━ RSI ━ 9MA0.93━ MACD ━ MACD Signal10 00:0017 00:0024 00:00

Levels and risk

PriceFrom entryR
Target510.61-3.81%+2.0R
Take half off525.80-0.95%+0.5R
Entry limit530.87base0R
Stop540.99+1.91%-1.0R
Risk-reward1:2
Exit styleScale out
531.09
StopTarget

What we see

  • The current key-level view for Microsoft is bullish with the pivot at 523.06, against this signal, so watch the pivot.
  • Swing Signals · US Stocks: backtest of 190 signals, 72% profitable, +0.30R each.
  • Microsoft: backtest of 18 signals, 72% profitable, +0.11R each.
  • To follow it: split into two orders, take the first off at the take-half price, then move the second order's stop to entry. See the steps
SignalOct 24, 2026 00:00FilledOct 26, 2026 20:00
LongLimit order pending

Copper 4H swing signal: bullish, go long

  • Signal issued Oct 27, 2026 20:00 (UTC+8, European session); valid: Up to about 10 trading days.
  • A limit order at 6.4871 fills only if price comes back; cancelled if not filled in time.
Signal6.6148TGT 6.61111/2 6.5615ENT 6.4871SL 6.3632━ MA20 + Bollinger Bands ━ MA50 4H70503065.05━ RSI ━ 9MA00.04━ MACD ━ MACD Signal10/13 08:0010/15 16:0010/19 20:0010/22 04:0010/26 08:00
Signal6.6148TGT6.61111/26.5615ENT6.4871SL6.3632━ MA20 ━ MA5070503065.05━ RSI ━ 9MA00.04━ MACD ━ MACD Signal22 16:0026 04:0027 20:00

Levels and risk

PriceFrom entryR
Target6.6111+1.91%+1.0R
Take half off6.5615+1.15%+0.6R
Entry limit6.4871base0R
Stop6.3632-1.91%-1.0R
Risk-reward1:1
Exit styleScale out
6.6148
StopTarget

What we see

  • The current key-level view for Copper is bullish with the pivot at 6.5672, in line with this signal.
  • Swing Signals · Commodities: backtest of 76 signals, 70% profitable, +0.22R each.
  • Copper: backtest of 30 signals, 67% profitable, +0.08R each.
  • To follow it: split into two orders, take the first off at the take-half price, then move the second order's stop to entry. See the steps
SignalOct 27, 2026 20:00
1-hour and 4-hour charts, held from about a day to a week. R = the risk taken on each signal (entry to stop). Past results do not guarantee future performance. All swing signals
Live levels and price alerts are in the appThe website refreshes every 30 minutes; the app streams live prices and pushes an alert when a level is hit. Get the App
FROM INFORMATION TO DECISION

Four things to know before a trade

Know what is happening today, find concrete levels, see the full picture for a market, then manage risk with a public record and alerts.

01

Stay informed

What is moving markets today.

02

Find opportunities

Concrete levels, direction and targets.

03

Decide

The full picture for one market.

04

Manage risk

Public results and alerts that keep you on plan.

Daily Picks

Today's focus from the Borearis Research Team
  • BNBUSDBullish

    Daily trend running for 79 days · signal active

  • NAS100Bullish

    Daily trend running for 57 days · signal active

  • JP225Bearish

    Daily trend running for 3 days · signal active

+6.2RCumulative result
36Closed signals
2.0RAverage win
-0.5RAverage loss

R = the risk defined for each signal. Full entries and exits are in the app.

Borearis Markets · Oct 28 Morning Brief

Market briefing
0:00
  • investingLive Americas market news wrap: Tech stocks rally
  • Americans Hit Hardest by War-Driven Oil Price Surge
  • France consumer confidence plunges to lowest since 2013 as fiscal worries deepen
  • China's Stock Market Has Lost $2.4 Trillion as Investors Doubt Its AI Boom Will Ever Pay Off
  • VanEck launches diversified ETF combining stocks, bonds and Bitcoin exposure

Twice a day. Available in six languages in the app.

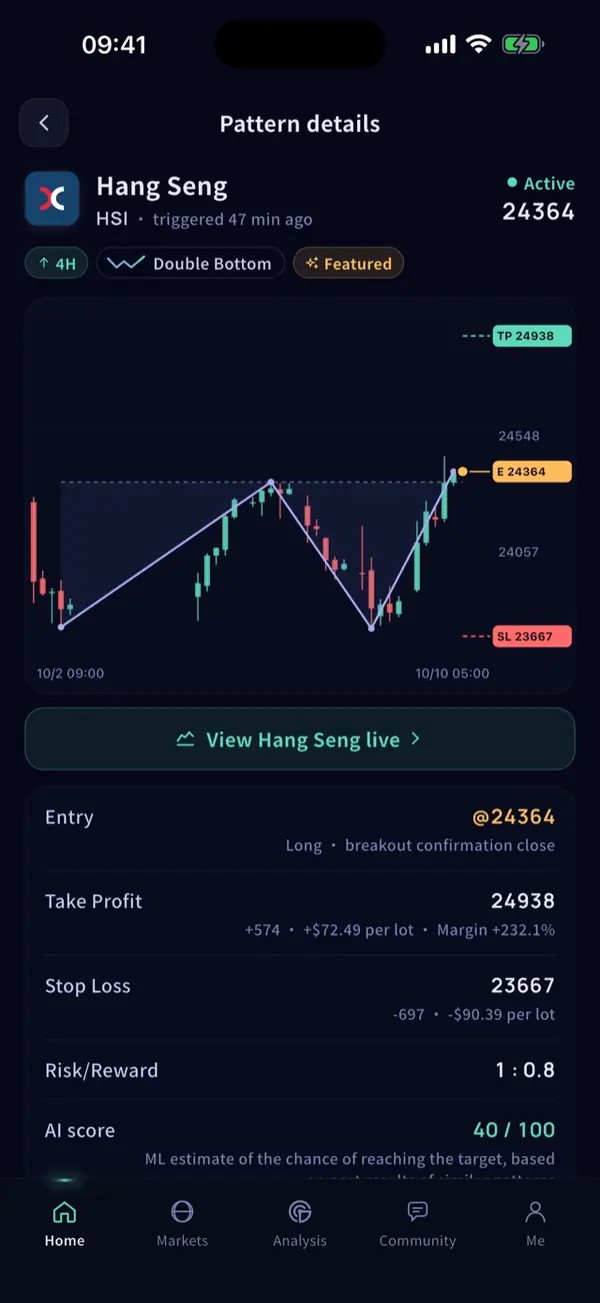
CHART PATTERNS

Patterns forming on the charts now

All chart patterns and results
ARM226.60
Bull flag15 min
Target228.480.83% Invalid at225.24
0% to target · confirmed Oct 28, 01:45 UTC+8

A sharp rise followed by a small pullback; a break above the consolidation usually means the uptrend resumes.

ECONOMIC CALENDAR

High-impact events ahead, and how much they move markets

Full economic calendar

Times in UTC+8. High-impact events only; the full calendar has filters, time zones and the history behind each number.

CHART SCHOOL

Three one-minute chart lessons, every day

HOW WE WORK

Every number can be checked after the fact

Borearis Research Team

Signals and levels come from our multi-timeframe quant model, calculated from live market data.

Public results

Every signal is timestamped and followed to the end, wins and losses alike.

Clear definitions

Backtests and live-quote look-backs are labelled separately and every signal since launch is published, all after spreads.
BOREARIS APP

One app, a complete trading research toolkit

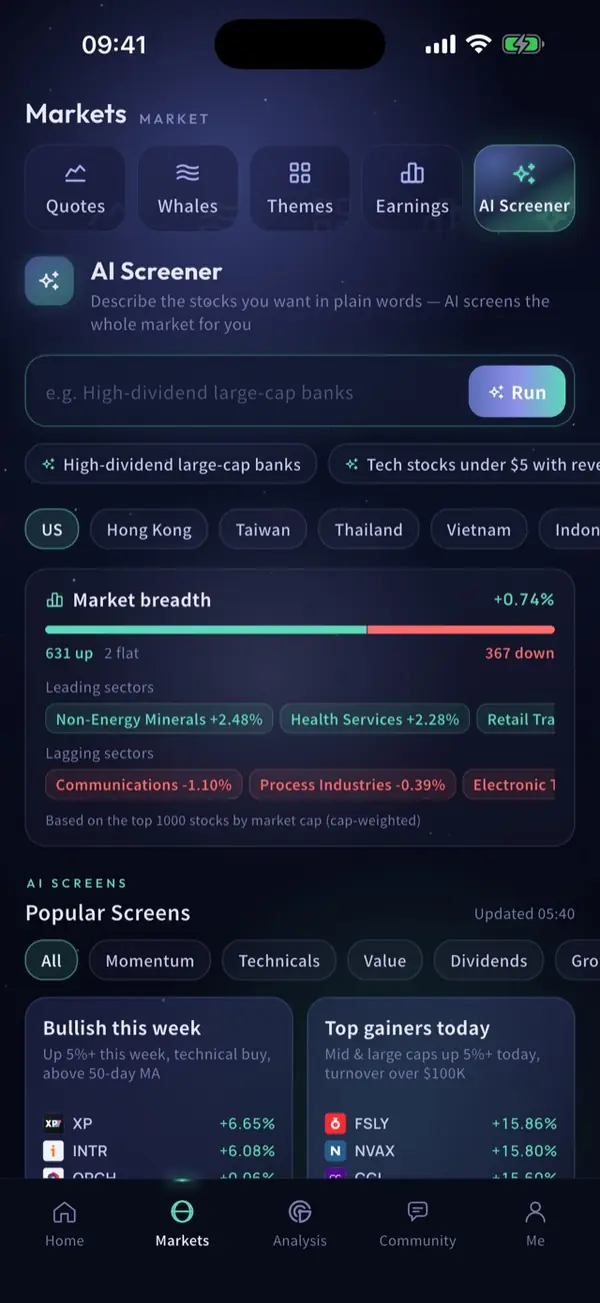
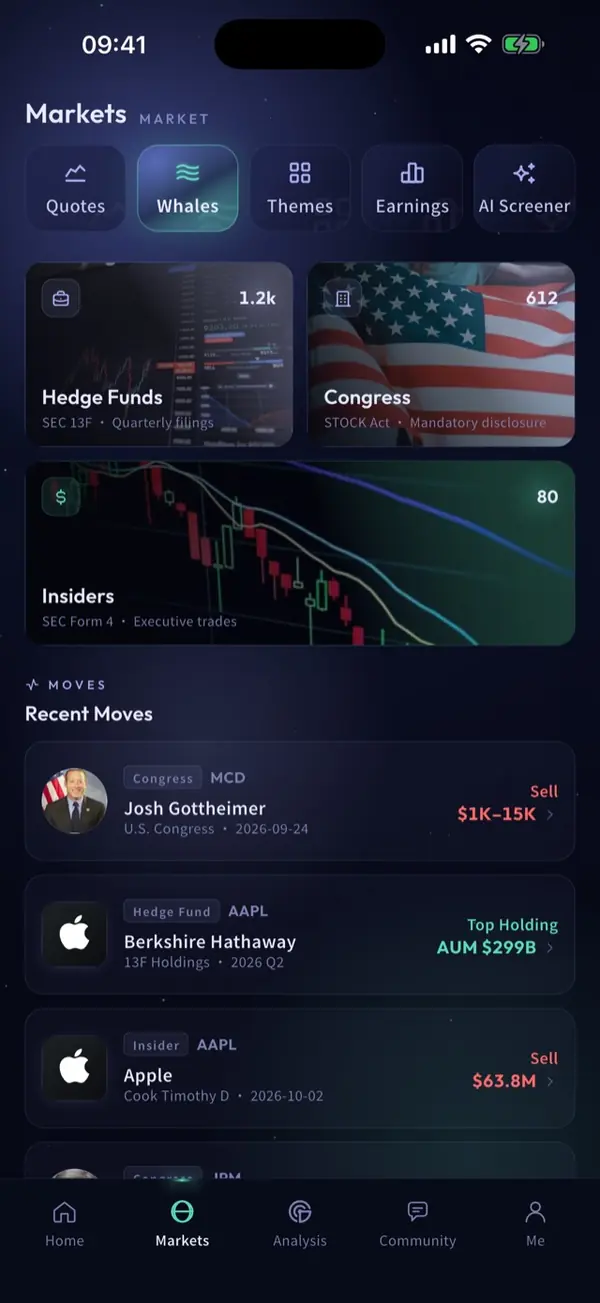
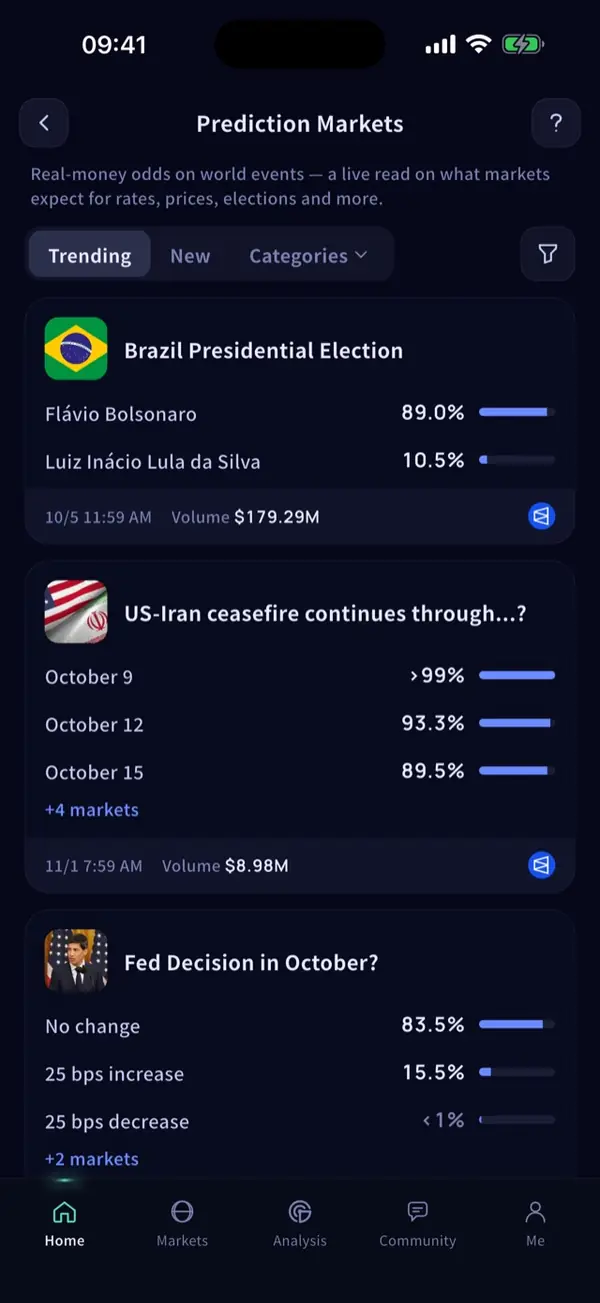
AI analysis Pattern engine AI screener Whale tracking Prediction markets Watchlist & alerts

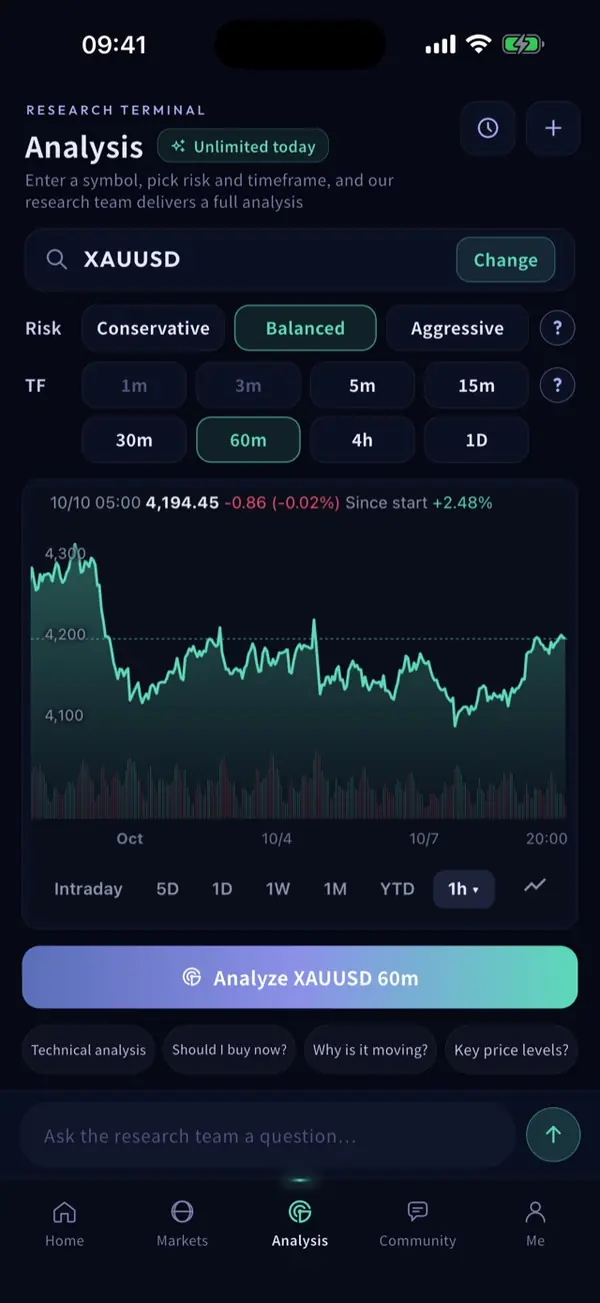
AI analysisAsk the research team anything: a chart, a market, tonight's data. Trend, key levels and risks in seconds.

FAQ

Frequently asked questions

How often is the website updated?

Short-term signals, swing signals and key levels are updated every 30 minutes, and prices on the cards and ticker refresh about every 5 seconds. The short-term (daily) key-level views are updated weekly.

Where do the signals and levels come from?

They are calculated from live market data by the Borearis Research Team's multi-timeframe quant model. Every signal is timestamped and tracked to the end, and every outcome is published.

Is it free?

Everything on the website is free, and the Borearis app is free to download.

How is the website different from the app?

The website is the public version, refreshed every 30 minutes. The app adds live levels, price alerts, full entries and exits for Daily Picks, AI analysis and AI commentary on economic data, in six languages.

What is the difference between short-term and swing signals?

Short-term signals use the 30-minute chart and are held from a few hours to a day; swing signals use the 1-hour and 4-hour charts and are held from about a day to a week. Both come with an entry, a stop and a target, most with a partial take-profit level as well, so you can pick the one that suits how you trade.

How are the results calculated?

Backtests and a six-month look-back on live quotes are shown separately, and every signal since launch is published one by one. All results are after spreads, and a candle that touches both stop and target counts as a stop. Wins and losses are published as they happen.

What is the win rate?

Short-term signals: 2,501 backtested over two years, +0.20R per signal on average, with up to 73% profitable in the best-performing asset classes. Swing signals: 1,668 backtested, 73% profitable, +0.17R per signal on average; 515 on live quotes over the last six months, 72% profitable. All after spreads. Past results do not guarantee future performance.

Get Borearis, free

On iOS and Android, in English, Traditional and Simplified Chinese, Thai, Vietnamese and Indonesian.

Download on the App Store Get it on Google Play