
Price tagged the 20 EMA. Bounce or break?
Price just tagged the moving average. Bounce or break? Make your call. Then watch the next ten candles.
- Watch the level, not the noise.
- Invalidation first, target second.
- One setup a day is enough.

The real chart used in this lesson
Real XAUUSD 1-hour chart · Oct 15 – Oct 17
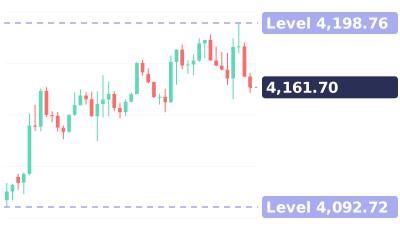
Quiz at the end: Which side would you take?
Full transcript
Price just tagged the moving average. Bounce or break?
Make your call. Then watch the next ten candles.
Gold, one hour. That is the 20 EMA, and it is rising.
Rising slope means buyers are still in control.
Second check: the candle. This one dipped below, then closed back above.
Long lower wick, close above the line. That is rejection.
Third check: the close. A full close through the EMA means the trend is breaking.
Here, it touched and held. Then price closed above and ran.
The move: over fifty dollars off the line.
Save this. Rising EMA, rejection wick, close above. Bounce.
Flat slope, close through the line. Break.
Which one are you taking? Bounce or break? Comment below.
Follow for one chart lesson every day.
go dot borearis dot com.
Keep watching



AI-voiced; written and reviewed by the Borearis Research Team. For education only, not investment advice. Trading involves risk.