
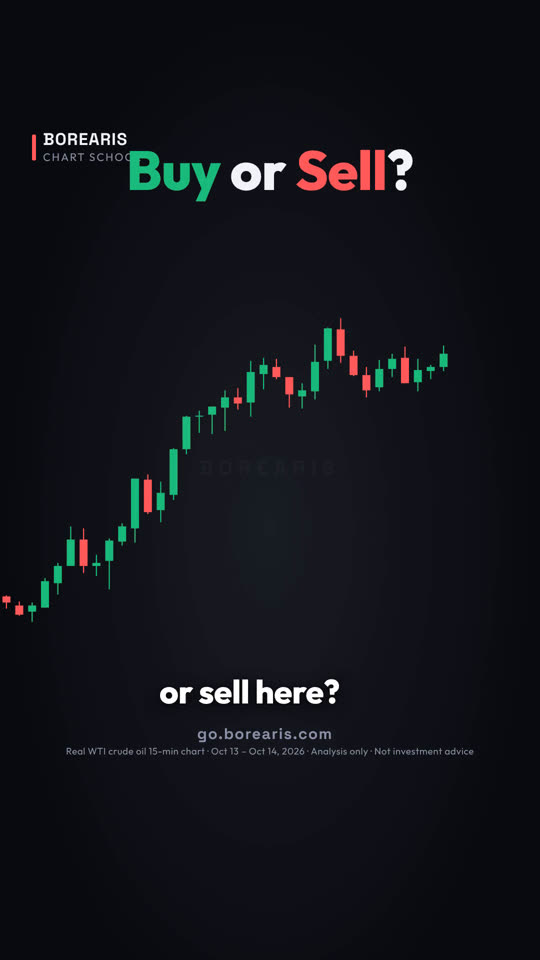
Would you buy or sell here?
Would you buy or sell here? You have five seconds to decide. First, the pole. Oil ripped two dollars higher in three and a half hours.
- Watch the level, not the noise.
- Invalidation first, target second.
- One setup a day is enough.

The real chart used in this lesson
Real WTI crude oil 15-min chart · Oct 13 – Oct 14, 2026
Quiz at the end: Which side would you take?
Full transcript
Would you buy or sell here? You have five seconds to decide.
First, the pole. Oil ripped two dollars higher in three and a half hours.
Then it stopped, and drifted lower in a tight little range.
That is a bull flag. Buyers are just catching their breath.
Rule one: the pullback has to stay shallow. This one gave back less than half the pole.
Rule two: it only counts on a close above the flag. A wick poking through is not enough.
Now here is where most people get it wrong. They chase the top of the pole, then panic when it dips.
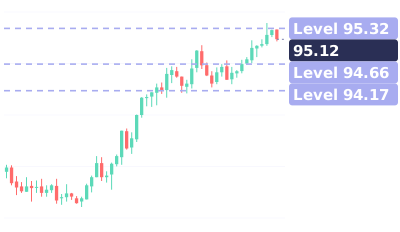
So you wait. Entry is the close above the flag, at 94.66.
Stop loss goes just under the flag low, at 94.17.
And take profit at 95.32. More reward than risk.
Just over an hour later, price hit the target.
Follow for one real setup like this, every day.
go dot borearis dot com.
Keep watching



AI-voiced; written and reviewed by the Borearis Research Team. For education only, not investment advice. Trading involves risk.