

How to tell a rally is over
Silver fell 17 percent in two days. The chart warned you three times before it fell. Most traders only see it after the drop. Here is how to spot it before.
- Watch the level, not the noise.
- Invalidation first, target second.
- One setup a day is enough.

The real chart used in this lesson
Real XAGUSD 1-hour chart · May 11 – May 18 · quiz: WTI 4-hour
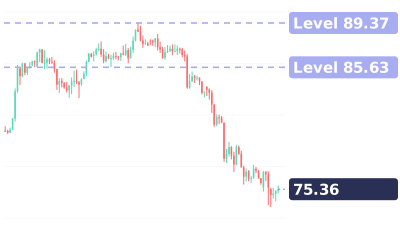
Quiz at the end: Which side would you take?
Full transcript
Silver fell 17 percent in two days. The chart warned you three times before it fell.
Most traders only see it after the drop. Here is how to spot it before.
First, the trend. Silver kept making higher highs and higher lows.
Signal one: the push gets weaker. The last leg up was shorter than the one before.
Signal two: no new high. The next bounce stalled below the top.
Signal three: a candle closes below the last higher low. The uptrend is broken.
One signal is just a warning. All three together, and the uptrend is likely done.
Here is what happened next.
This is not a prediction. It tells you when to stop buying the dip, and protect your profit.
Your turn. This is oil. How many of the three signals do you see? Comment zero to three.
Follow for one chart lesson every day.
go dot borearis dot com.
Keep watching


AI-voiced; written and reviewed by the Borearis Research Team. For education only, not investment advice. Trading involves risk.