
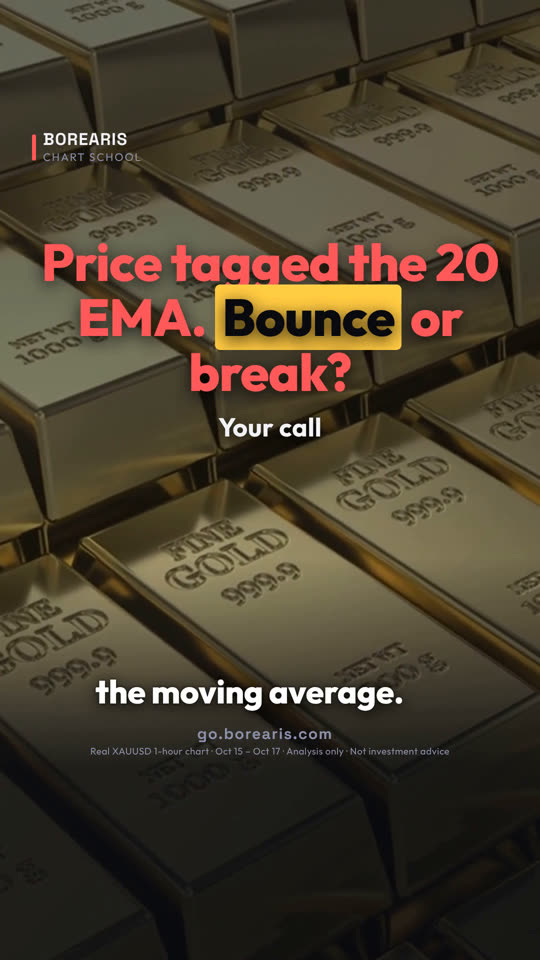

这堂课用的真实 K 线
Real XAUUSD 1-hour chart · Oct 15 – Oct 17
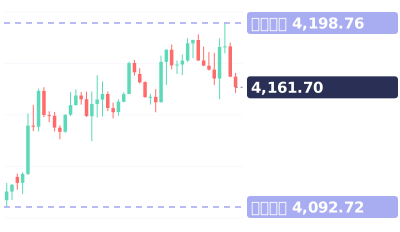
视频最后的小测验:你会选哪一边进场?
视频完整旁白(英文原文)
Price just tagged the moving average. Bounce or break?
Make your call. Then watch the next ten candles.
Gold, one hour. That is the 20 EMA, and it is rising.
Rising slope means buyers are still in control.
Second check: the candle. This one dipped below, then closed back above.
Long lower wick, close above the line. That is rejection.
Third check: the close. A full close through the EMA means the trend is breaking.
Here, it touched and held. Then price closed above and ran.
The move: over fifty dollars off the line.
Save this. Rising EMA, rejection wick, close above. Bounce.
Flat slope, close through the line. Break.
Which one are you taking? Bounce or break? Comment below.
Follow for one chart lesson every day.
go dot borearis dot com.
接着看

视频为 AI 配音,内容由 Borearis 研究团队撰写审核。仅供学习参考,不构成投资建议,交易有风险。