

哪一根 K 线改变了趋势?
这张图的趋势翻转了,是哪一根造成的?答对了,你就不用再猜顶猜底。
- 在上升趋势中,标记最后一个更高的低点。
- 趋势的改变是当 K 线收盘跌破它时,而不是在最高的那根 K 线。
- 顶部只是历史。突破才是信号。
- 真实的 USDJPY 4 小时图:收盘跌破 159.47 是在顶部之后第三根 K 线出现。


这堂课用的真实 K 线
Real USDJPY 4-hour chart · Aug 21 – Sep 3 · quiz: GBPUSD 4-hour
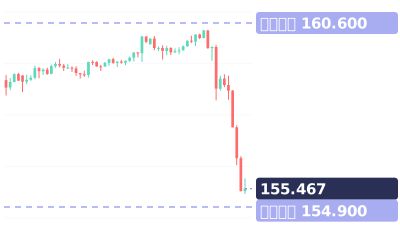
视频最后的小测验:这张英镑图表正在下跌。K 线 A、B 还是 C:趋势在哪里改变?
视频完整旁白(英文原文)
The trend flipped on this chart. Which candle did it?
Get this right and you stop guessing tops and bottoms.
Dollar-yen, 4-hour. A: the top. B: the first big red candle. C: a few candles later.
Most people pick A. But at A, nobody knew it was the top.
In an uptrend, watch the last higher low. Here, 159.47.
B dropped hard, but closed above it. Uptrend still intact.
C closed below it, at 158.57. That's where the trend changed.
The top is just history. The break is the signal.
The next day, it was down at 155.30.
Save this. Mark the last higher low. A close below it: trend changed. Not the top candle.
Your turn. This pound chart was falling. A, B or C: where did the trend change? Comment below.
Follow for one chart lesson every day.
go dot borearis dot com.
接着看



视频为 AI 配音,内容由 Borearis 研究团队撰写审核。仅供学习参考,不构成投资建议,交易有风险。