

哪一根 K 線改變了趨勢?
這張圖的趨勢翻轉了,是哪一根造成的?答對了,你就不用再猜頂猜底。
- 在上升趨勢中,標記最後一個更高的低點。
- 趨勢的改變是當 K 線收盤跌破它時,而不是在最高的那根 K 線。
- 頂部只是歷史。突破才是訊號。
- 真實的 USDJPY 4 小時圖:收盤跌破 159.47 是在頂部之後第三根 K 線出現。


這堂課用的真實 K 線
Real USDJPY 4-hour chart · Aug 21 – Sep 3 · quiz: GBPUSD 4-hour
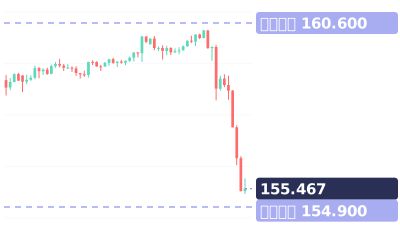
影片最後的小測驗:這張英鎊圖表正在下跌。K 線 A、B 還是 C:趨勢在哪裡改變?
影片完整旁白(英文原文)
The trend flipped on this chart. Which candle did it?
Get this right and you stop guessing tops and bottoms.
Dollar-yen, 4-hour. A: the top. B: the first big red candle. C: a few candles later.
Most people pick A. But at A, nobody knew it was the top.
In an uptrend, watch the last higher low. Here, 159.47.
B dropped hard, but closed above it. Uptrend still intact.
C closed below it, at 158.57. That's where the trend changed.
The top is just history. The break is the signal.
The next day, it was down at 155.30.
Save this. Mark the last higher low. A close below it: trend changed. Not the top candle.
Your turn. This pound chart was falling. A, B or C: where did the trend change? Comment below.
Follow for one chart lesson every day.
go dot borearis dot com.
接著看



影片為 AI 配音,內容由 Borearis 研究團隊撰寫審核。僅供學習參考,不構成投資建議,交易有風險。