
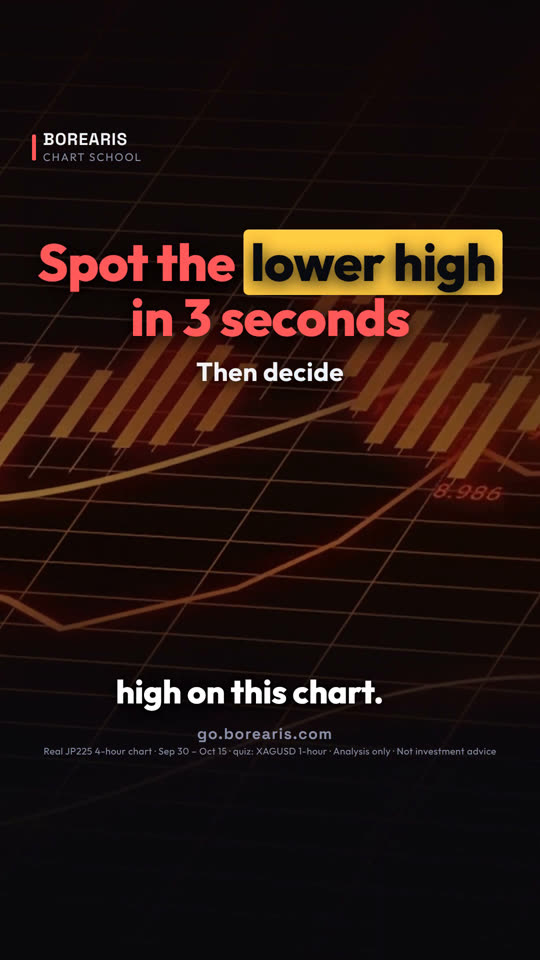
這堂課用的真實 K 線
Real JP225 4-hour chart · Sep 30 – Oct 15 · quiz: XAGUSD 1-hour
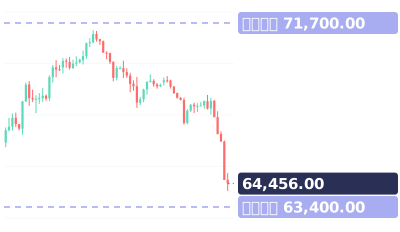
影片最後的小測驗:白銀 1 小時圖。哪一個點是較低的高點:A、B 還是 C?
影片完整旁白(英文原文)
Find the lower high on this chart. Three seconds.
It's the point that tells you the uptrend is in trouble.
Time's up. It's C.
Nikkei, 4-hour. A and B each made a new high. Uptrend.
C topped at 69,382. It couldn't reach B at 71,372. That's a lower high.
A is lower, but at the time, it was a new high.
A lower high is a warning, not a signal yet.
The signal: a close below the last low, 67,871. That came on October 13.
Sellers often put their stops just above the lower high.
Two days later, the Nikkei was down at 64,124.
Save this. Lower high: warning. Close below the last low: signal. Stops go above the lower high.
Your turn. Silver, 1-hour. Which point is the lower high: A, B or C? Comment below.
Follow for one chart lesson every day.
go dot borearis dot com.
接著看


影片為 AI 配音,內容由 Borearis 研究團隊撰寫審核。僅供學習參考,不構成投資建議,交易有風險。