
Spot the lower high in 3 seconds
Find the lower high on this chart. Three seconds. It's the point that tells you the uptrend is in trouble.
- A lower high is a rally that couldn't reach the last high.
- It's a warning, not the signal. The signal is a close below the last low.
- Sellers often put their stops just above the lower high.
- Real Nikkei 4-hour chart: lower high at 69,382, closed below 67,871 on Oct 13.
The real chart used in this lesson
Real JP225 4-hour chart · Sep 30 – Oct 15 · quiz: XAGUSD 1-hour
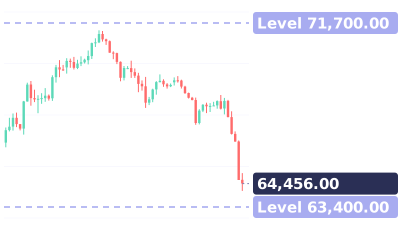
Quiz at the end: Silver, 1-hour. Which point is the lower high: A, B or C?
Full transcript
Find the lower high on this chart. Three seconds.
It's the point that tells you the uptrend is in trouble.
Time's up. It's C.
Nikkei, 4-hour. A and B each made a new high. Uptrend.
C topped at 69,382. It couldn't reach B at 71,372. That's a lower high.
A is lower, but at the time, it was a new high.
A lower high is a warning, not a signal yet.
The signal: a close below the last low, 67,871. That came on October 13.
Sellers often put their stops just above the lower high.
Two days later, the Nikkei was down at 64,124.
Save this. Lower high: warning. Close below the last low: signal. Stops go above the lower high.
Your turn. Silver, 1-hour. Which point is the lower high: A, B or C? Comment below.
Follow for one chart lesson every day.
go dot borearis dot com.
Keep watching



AI-voiced; written and reviewed by the Borearis Research Team. For education only, not investment advice. Trading involves risk.