
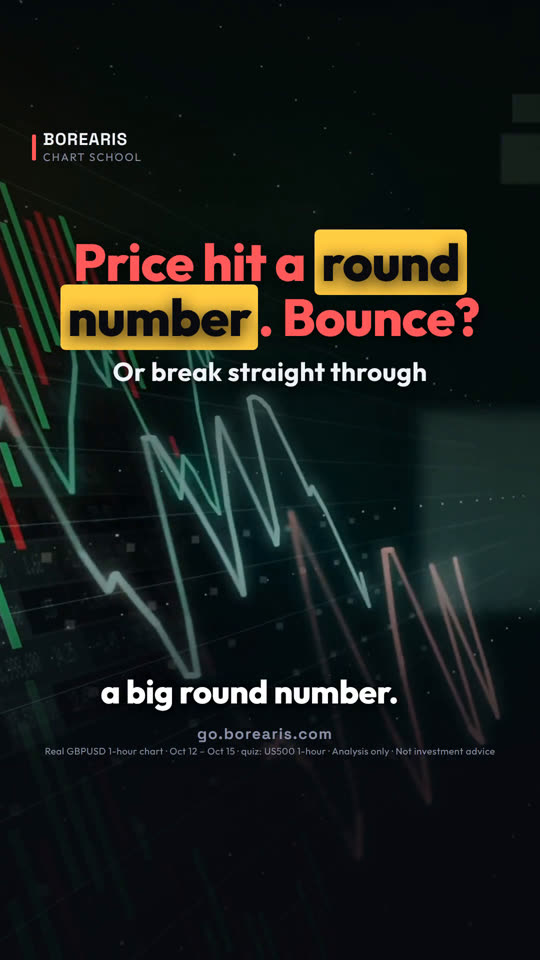
價格碰到整數關口,會反彈嗎?
價格剛到大整數關口,反彈還是直接突破?看它是怎麼來的。
- 看價格是怎麼走到這個位置的,不只看它現在在哪裡。
- 如果是緩慢、小根的 K 線走到整數關卡:比較可能卡住。
- 如果是又大又強的 K 線走到整數關卡:比較可能突破。
- 不管是哪一種,都要等 K 線收盤後再決定站哪一邊。


這堂課用的真實 K 線
Real GBPUSD 1-hour chart · Oct 12 – Oct 15 · quiz: US500 1-hour
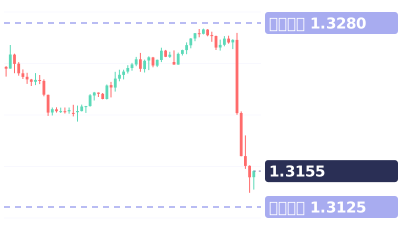
影片最後的小測驗:標普 500 剛剛觸及 7,700。要買反彈、賣出,還是先觀望?
影片完整旁白(英文原文)
Price just reached a big round number.
Bounce or break? Look at how it arrived.
Pound-dollar, 1-hour chart. The number is 1.3200.
First visit: small candles, drifting in slowly. The move was losing steam.
It poked to 1.3197, but no candle closed below. Then it bounced to 1.3275.
Second visit: one huge red candle, straight into the number.
Big, fast candles like this are more likely to break through.
But still wait for the close. The next candle closed below, at 1.3168.
That confirmed the break. It dropped to 1.3137.
Save this. Slow, small candles: likely to stall. Big, strong candles: more likely to break. Either way, wait for a close.
Your turn. The S&P 500 just touched 7,700. Buy the bounce, sell, or wait? Comment below.
Follow for one chart lesson every day.
go dot borearis dot com.
接著看



影片為 AI 配音,內容由 Borearis 研究團隊撰寫審核。僅供學習參考,不構成投資建議,交易有風險。