

這堂課用的真實 K 線
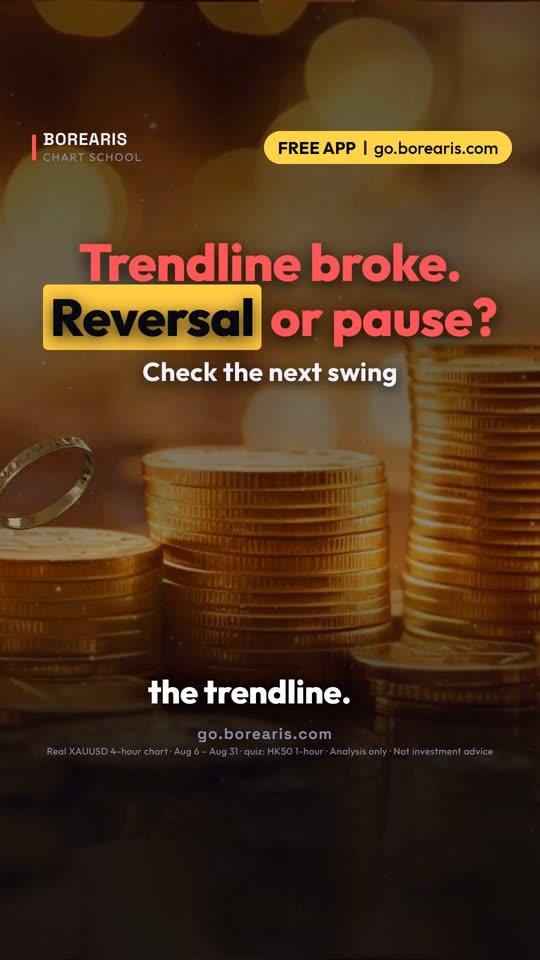
Real XAUUSD 4-hour chart · Aug 6 – Aug 31 · quiz: HK50 1-hour
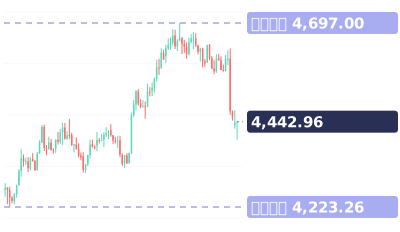
影片最後的小測驗:趨勢線剛剛被突破。應該賣出、買入,還是等下一段波段?
影片完整旁白(英文原文)
Price just broke the trendline. Is the trend over?
Not always. The next swing tells you if it's a reversal or just a pause.
Gold, 4-hour chart. On August 19, a candle closed below the uptrend line.
Don't sell yet. Watch the next swing high.
It went to 4,527, above the 4,450 high. New high: the trend is alive.
Then a new trendline. On August 27, it broke again.
This time the bounce peaked at 4,618, below the 4,697 high. A lower high.
Gold then broke the swing low and fell to 4,396.
So a broken trendline only slows the trend. The next swing decides.
Save this. Line breaks: wait. New high next: the trend is alive. Lower high next: likely reversal.
Your turn. This trendline just broke. Sell, buy, or wait for the next swing? Comment below.
Follow for one chart lesson every day.
go dot borearis dot com.
接著看

影片為 AI 配音,內容由 Borearis 研究團隊撰寫審核。僅供學習參考,不構成投資建議,交易有風險。