
Trendline broke. Reversal or just a pause?
Price just broke the trendline. Is the trend over? Not always. The next swing tells you if it's a reversal or just a pause.
- A trendline break slows the trend. It doesn't end it by itself.
- Next swing makes a new high: the trend is still alive.
- Next swing makes a lower high: a reversal is more likely.
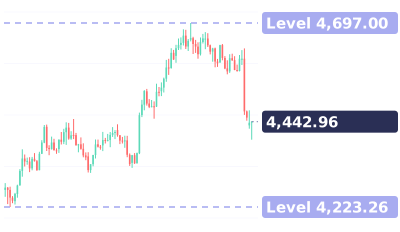
- Real gold 4-hour chart: one break led to a new high, the next one to a lower high and a drop.

The real chart used in this lesson
Real XAUUSD 4-hour chart · Aug 6 – Aug 31 · quiz: HK50 1-hour
Quiz at the end: The trendline just broke. Sell, buy, or wait for the next swing?
Full transcript
Price just broke the trendline. Is the trend over?
Not always. The next swing tells you if it's a reversal or just a pause.
Gold, 4-hour chart. On August 19, a candle closed below the uptrend line.
Don't sell yet. Watch the next swing high.
It went to 4,527, above the 4,450 high. New high: the trend is alive.
Then a new trendline. On August 27, it broke again.
This time the bounce peaked at 4,618, below the 4,697 high. A lower high.
Gold then broke the swing low and fell to 4,396.
So a broken trendline only slows the trend. The next swing decides.
Save this. Line breaks: wait. New high next: the trend is alive. Lower high next: likely reversal.
Your turn. This trendline just broke. Sell, buy, or wait for the next swing? Comment below.
Follow for one chart lesson every day.
go dot borearis dot com.
Keep watching


AI-voiced; written and reviewed by the Borearis Research Team. For education only, not investment advice. Trading involves risk.