
Price hit a round number. Bounce or break?
Price just reached a big round number. Bounce or break? Look at how it arrived.
- Look at how price arrived, not just where it is.
- Slow, small candles into the number: more likely to stall.
- Big, strong candles into the number: more likely to break.
- Either way, wait for a candle to close before you pick a side.


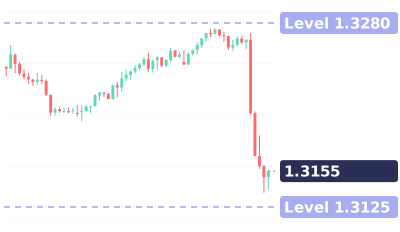
The real chart used in this lesson
Real GBPUSD 1-hour chart · Oct 12 – Oct 15 · quiz: US500 1-hour
Quiz at the end: The S&P 500 just touched 7,700. Buy the bounce, sell, or wait?
Full transcript
Price just reached a big round number.
Bounce or break? Look at how it arrived.
Pound-dollar, 1-hour chart. The number is 1.3200.
First visit: small candles, drifting in slowly. The move was losing steam.
It poked to 1.3197, but no candle closed below. Then it bounced to 1.3275.
Second visit: one huge red candle, straight into the number.
Big, fast candles like this are more likely to break through.
But still wait for the close. The next candle closed below, at 1.3168.
That confirmed the break. It dropped to 1.3137.
Save this. Slow, small candles: likely to stall. Big, strong candles: more likely to break. Either way, wait for a close.
Your turn. The S&P 500 just touched 7,700. Buy the bounce, sell, or wait? Comment below.
Follow for one chart lesson every day.
go dot borearis dot com.
Keep watching


AI-voiced; written and reviewed by the Borearis Research Team. For education only, not investment advice. Trading involves risk.