

Which candle changed the trend? Not the top one
The trend flipped on this chart. Which candle did it? Get this right and you stop guessing tops and bottoms.
- In an uptrend, mark the last higher low.
- The trend changes when a candle closes below it, not at the highest candle.
- The top is just history. The break is the signal.
- Real USDJPY 4-hour chart: the close below 159.47 came three candles after the top.


The real chart used in this lesson
Real USDJPY 4-hour chart · Aug 21 – Sep 3 · quiz: GBPUSD 4-hour
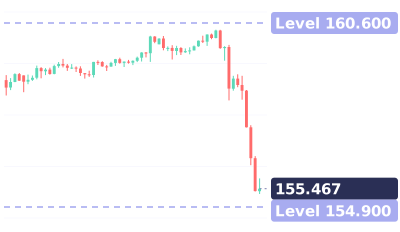
Quiz at the end: This pound chart was falling. Candle A, B or C: where did the trend change?
Full transcript
The trend flipped on this chart. Which candle did it?
Get this right and you stop guessing tops and bottoms.
Dollar-yen, 4-hour. A: the top. B: the first big red candle. C: a few candles later.
Most people pick A. But at A, nobody knew it was the top.
In an uptrend, watch the last higher low. Here, 159.47.
B dropped hard, but closed above it. Uptrend still intact.
C closed below it, at 158.57. That's where the trend changed.
The top is just history. The break is the signal.
The next day, it was down at 155.30.
Save this. Mark the last higher low. A close below it: trend changed. Not the top candle.
Your turn. This pound chart was falling. A, B or C: where did the trend change? Comment below.
Follow for one chart lesson every day.
go dot borearis dot com.
Keep watching


AI-voiced; written and reviewed by the Borearis Research Team. For education only, not investment advice. Trading involves risk.