

这堂课用的真实 K 线
Real NAS100 4-hour chart · Oct 5 – Oct 13 · quiz: US500 1-hour
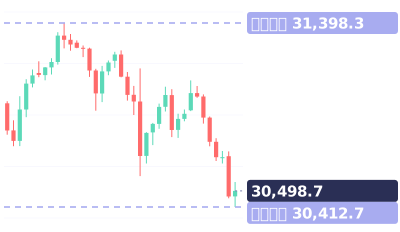
视频最后的小测验:这个 S&P 500 三角形,突破之前。买、卖,还是等?
视频完整旁白(英文原文)
Price is getting squeezed. Which way will it break?
Nobody knows. And you don't need to.
Nasdaq 100, 4-hour chart. Each high is lower than the last.
Each low is higher. That's a squeeze.
Inside the squeeze, don't trade. Price just chops both ways.
Wait for a candle to close outside the lines.
On October 12, one closed below, at 30,891. That's the signal: sell the break.
Stop back inside, above the last high at 31,091.
By the next morning, the Nasdaq was down at 30,413.
Breaks up instead? Flip it. Buy the close above, stop back inside.
Save this. Lower highs plus higher lows: a squeeze. Don't trade inside. Trade the close outside. Stop back inside.
Your turn. This S&P 500 triangle, before the break. Buy, sell, or wait? Comment below.
Follow for one chart lesson every day.
go dot borearis dot com.
接着看


视频为 AI 配音,内容由 Borearis 研究团队撰写审核。仅供学习参考,不构成投资建议,交易有风险。