

Triangle squeeze: up or down? You don't need to guess
Price is getting squeezed. Which way will it break? Nobody knows. And you don't need to.
- Lower highs plus higher lows = a squeeze.
- Don't trade inside it. Wait for a candle to close outside the lines.
- Trade the break, with your stop back inside the triangle.
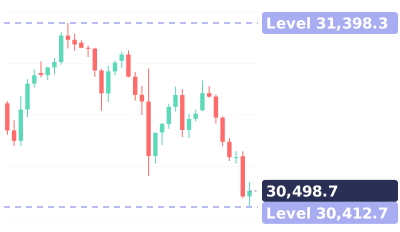
- Real Nasdaq 100 4-hour chart: closed below at 30,891, down at 30,413 by the next morning.
The real chart used in this lesson
Real NAS100 4-hour chart · Oct 5 – Oct 13 · quiz: US500 1-hour
Quiz at the end: This S&P 500 triangle, before the break. Buy, sell, or wait?
Full transcript
Price is getting squeezed. Which way will it break?
Nobody knows. And you don't need to.
Nasdaq 100, 4-hour chart. Each high is lower than the last.
Each low is higher. That's a squeeze.
Inside the squeeze, don't trade. Price just chops both ways.
Wait for a candle to close outside the lines.
On October 12, one closed below, at 30,891. That's the signal: sell the break.
Stop back inside, above the last high at 31,091.
By the next morning, the Nasdaq was down at 30,413.
Breaks up instead? Flip it. Buy the close above, stop back inside.
Save this. Lower highs plus higher lows: a squeeze. Don't trade inside. Trade the close outside. Stop back inside.
Your turn. This S&P 500 triangle, before the break. Buy, sell, or wait? Comment below.
Follow for one chart lesson every day.
go dot borearis dot com.
Keep watching


AI-voiced; written and reviewed by the Borearis Research Team. For education only, not investment advice. Trading involves risk.