

Price hit the moving average. Bounce or break?
Price just pulled back to the moving average. In a strong trend, this is where buyers often step in. Here's how to tell.
- Only use the 20 EMA in a clear trend: the line must slope.
- Wait for a rejection candle at the line: wick through, close back above.
- Buy on that close, stop under the wick.
- Exit if price closes through the line.


The real chart used in this lesson
Real USDJPY 4-hour chart · Jul 16 – Jul 30 · quiz: EURUSD 4-hour
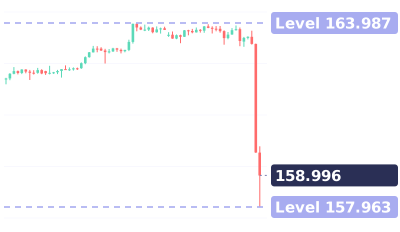
Quiz at the end: Euro at its 20 EMA. Bounce or break?
Full transcript
Price just pulled back to the moving average.
In a strong trend, this is where buyers often step in. Here's how to tell.
Real dollar-yen chart, 4-hour. The blue line: the 20 EMA, an average of 20 candles.
Rule one: only use it in a clear trend. Here, the line slopes up.
Rule two: wait for a rejection candle at the line.
On July 22, this candle dipped below it, then closed back above at 163.03.
That's the buy, stop under the wick. Next day: 163.96.
Rule three: exit if price closes through the line.
July 29, it closed below. Out. The next day, it crashed below 160.
Save this. Line sloping. Rejection candle: buy, stop under the wick. Close through: exit.
Your turn. Euro at its 20 EMA. Bounce or break? Comment below.
Follow for one chart lesson every day.
go dot borearis dot com.
Keep watching


AI-voiced; written and reviewed by the Borearis Research Team. For education only, not investment advice. Trading involves risk.