

碰到均线了,反弹还是跌破?
价格刚回调到均线。强趋势里,买方常在这里进场。教你怎么判断。
- 只在明确的趋势中使用 20 均线:这条线必须有斜率。
- 等待价格在均线位置出现拒绝的 K 线:影线穿过均线,收盘又回到均在线方。
- 在该根 K 线收盘时买入,止损放在影线下方。
- 如果价格收盘跌破均线,就出场。


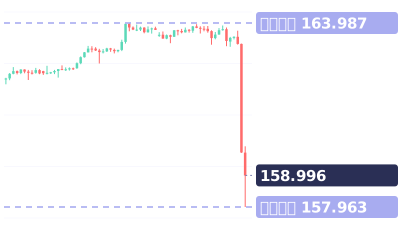
这堂课用的真实 K 线
Real USDJPY 4-hour chart · Jul 16 – Jul 30 · quiz: EURUSD 4-hour
视频最后的小测验:欧元来到 20 均线。是反弹还是跌破?
视频完整旁白(英文原文)
Price just pulled back to the moving average.
In a strong trend, this is where buyers often step in. Here's how to tell.
Real dollar-yen chart, 4-hour. The blue line: the 20 EMA, an average of 20 candles.
Rule one: only use it in a clear trend. Here, the line slopes up.
Rule two: wait for a rejection candle at the line.
On July 22, this candle dipped below it, then closed back above at 163.03.
That's the buy, stop under the wick. Next day: 163.96.
Rule three: exit if price closes through the line.
July 29, it closed below. Out. The next day, it crashed below 160.
Save this. Line sloping. Rejection candle: buy, stop under the wick. Close through: exit.
Your turn. Euro at its 20 EMA. Bounce or break? Comment below.
Follow for one chart lesson every day.
go dot borearis dot com.
接着看


视频为 AI 配音,内容由 Borearis 研究团队撰写审核。仅供学习参考,不构成投资建议,交易有风险。