
Retest held with a long wick. Enter or trap?
Price retested the breakout and left a long wick. Is that your entry, or a trap? Read the wick.
- Breakout, then price comes back to test the old high.
- Long lower wick, close back above the level = buyers defending it.
- Enter on the close. Stop just below the wick.
- Wick pokes through but the candle closes below the level? Skip it.

The real chart used in this lesson
Real XAUUSD 4-hour chart · Aug 11 – Aug 24 · quiz: BTCUSDT 1-hour
Quiz at the end: Bitcoin retested a breakout with a wick. Buy, wait, or sell?
Full transcript
Price retested the breakout and left a long wick.
Is that your entry, or a trap? Read the wick.
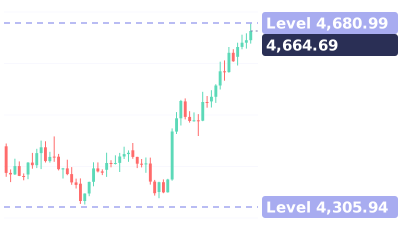
Real gold 4-hour chart. Gold broke above the old high near 4,450.
Then it came back to test it. Look at this candle.
It dipped to 4,451, right at the level, then closed back up at 4,482.
That long lower wick means buyers defended the level.
So enter on the close, with your stop just below the wick.
By August 24, gold hit 4,681.
Now the trap: the wick pokes through, but the candle closes below the level. Skip it.
Save this. Long wick, close above the level: enter, stop below the wick. Close below: skip.
Your turn. Bitcoin retested this breakout with a wick. Buy, wait, or sell? Comment below.
Follow for one chart lesson every day.
go dot borearis dot com.
Keep watching


AI-voiced; written and reviewed by the Borearis Research Team. For education only, not investment advice. Trading involves risk.