
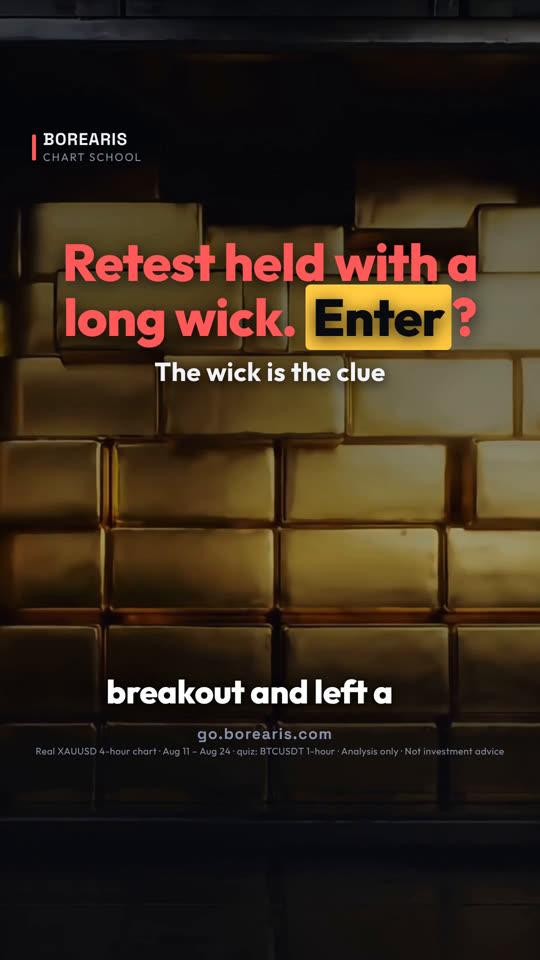

這堂課用的真實 K 線
Real XAUUSD 4-hour chart · Aug 11 – Aug 24 · quiz: BTCUSDT 1-hour
影片最後的小測驗:比特幣回調測試突破時留下一根影線。該買進、再等等,還是賣出?
影片完整旁白(英文原文)
Price retested the breakout and left a long wick.
Is that your entry, or a trap? Read the wick.
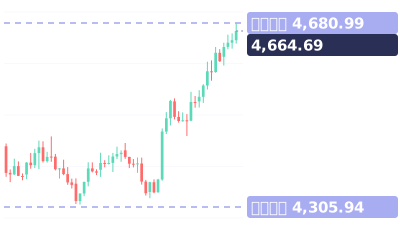
Real gold 4-hour chart. Gold broke above the old high near 4,450.
Then it came back to test it. Look at this candle.
It dipped to 4,451, right at the level, then closed back up at 4,482.
That long lower wick means buyers defended the level.
So enter on the close, with your stop just below the wick.
By August 24, gold hit 4,681.
Now the trap: the wick pokes through, but the candle closes below the level. Skip it.
Save this. Long wick, close above the level: enter, stop below the wick. Close below: skip.
Your turn. Bitcoin retested this breakout with a wick. Buy, wait, or sell? Comment below.
Follow for one chart lesson every day.
go dot borearis dot com.
接著看
影片為 AI 配音,內容由 Borearis 研究團隊撰寫審核。僅供學習參考,不構成投資建議,交易有風險。