
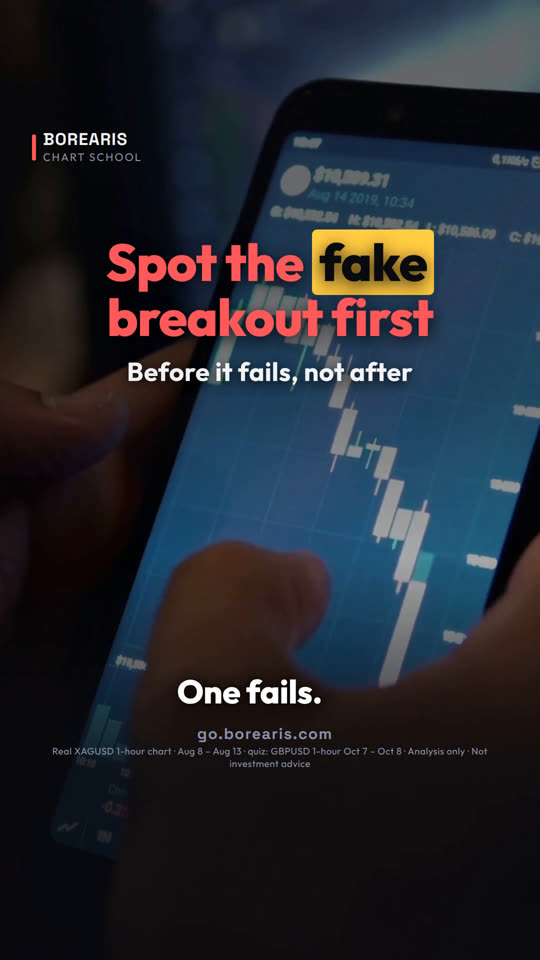
Spot the fake breakout first: 3 clues before it fails
Two breakouts. One fails. Can you tell which? Most people only see it after the loss. Look at these three clues.
- Clue 1: a weak close near the level is a warning.
- Clue 2: a long wick back inside means sellers are waiting up there.
- Clue 3: a strong close plus a follow-through candle is a real breakout.
- Real silver 1H, Aug 10–13: A closed strong and ran to 66.47. B wicked to 66.79, closed back under, then fell to 65.07.

The real chart used in this lesson
Real XAGUSD 1-hour chart · Aug 8 – Aug 13 · quiz: GBPUSD 1-hour Oct 7 – Oct 8
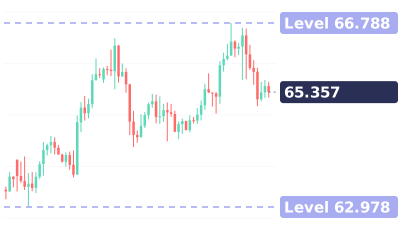
Quiz at the end: This pound breakout: buy it, skip it, or wait for the next candle?
Full transcript
Two breakouts. One fails. Can you tell which?
Most people only see it after the loss. Look at these three clues.
Clue one: a weak close near the level. B closed back under it.
Clue two: a long wick back inside. Sellers were waiting up there.
Clue three: a strong close, then a follow-through candle. That's A.
A kept climbing, up to 66.47.
B dropped back to 65.07 within seven hours.
So don't buy the first poke above. Wait for the close, and the next candle.
Save this. Weak close or long wick: stay out. Strong close plus follow-through: it's real.
Your turn. Real or fake? Buy it, skip it, or wait for the next candle? Comment below.
Follow for one chart lesson every day.
go dot borearis dot com.
Keep watching

AI-voiced; written and reviewed by the Borearis Research Team. For education only, not investment advice. Trading involves risk.