
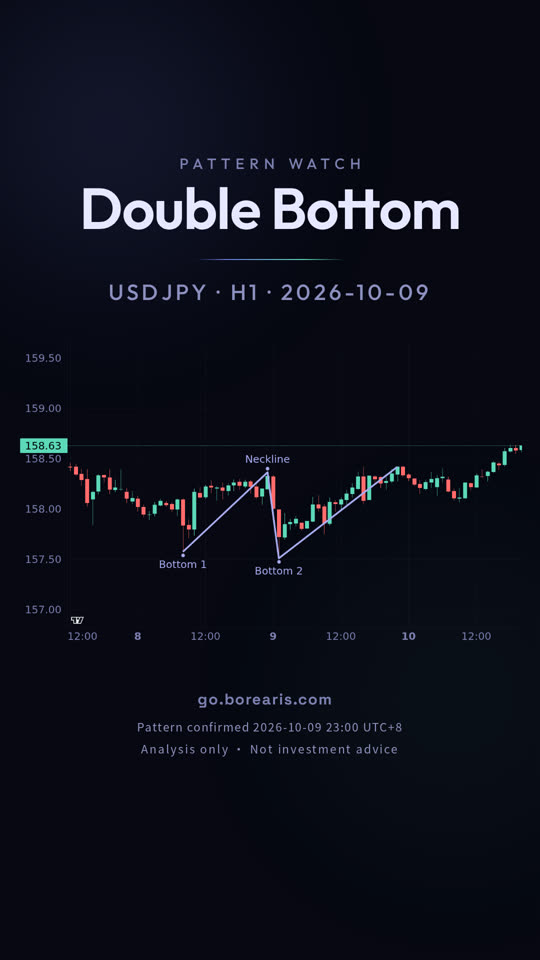
USD/JPY 1-hour chart: Double Bottom
A double bottom on the USD/JPY 1-hour chart, bullish. The video shows how to spot it, where to enter and where the stop and target go.
- Pattern: Double Bottom (bullish)
- Entry 158.41700, stop 157.47100, target 159.21800


Full transcript
The dollar against the yen hit the same floor twice.
October 12, on the hourly dollar against the yen chart, a double bottom confirmed last Friday.
A double bottom is price holding twice at the same area, with a high in between.
That middle high is the neckline, and a close above it is what confirms the pattern.
The neckline is 158.363, and the measured target is 159.218.
The invalidation level is 157.471; a close below it cancels the pattern.
This pattern is still open, and neither the target nor the invalidation level has been hit yet.
A pattern never guarantees its target, and the same shape fails just as often.
go dot borearis dot com
Keep watching
AI-voiced; written and reviewed by the Borearis Research Team. For education only, not investment advice. Trading involves risk.