
Full transcript
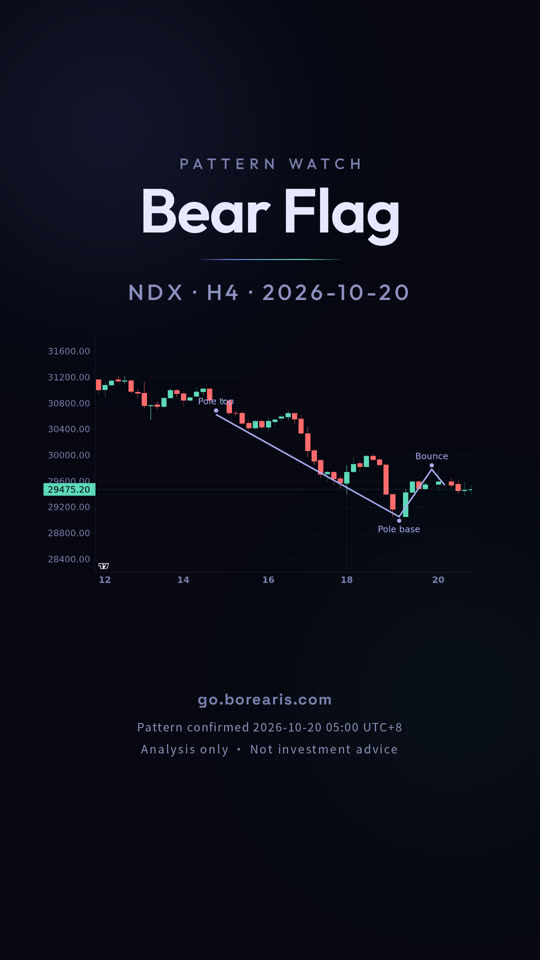
The Nasdaq dropped hard, then drifted up in a quiet, narrow crawl.
October 20, on the Nasdaq, the 4-hour chart, this bear flag confirmed today.
In plain terms, a sharp drop formed the pole, then a shallow drift higher formed the flag.
The confirmation was a close below the lower rail at 29626.8.
The measured target is 29018.1.
The invalidation level is 29826.2, and a close beyond it cancels the pattern.
The setup is still open: neither the target nor the invalidation level has been hit.
A pattern never guarantees its target, and the same shape fails just as often.
go dot borearis dot com.
MORE LESSONS
Keep watching



AI-voiced; written and reviewed by the Borearis Research Team. For education only, not investment advice. Trading involves risk.