
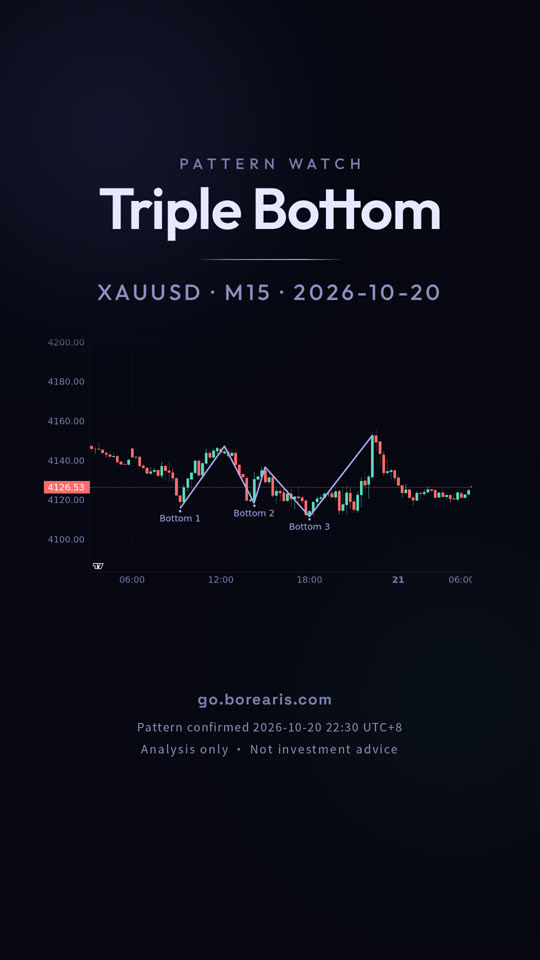
Gold (XAU/USD) 15-minute chart: Triple Bottom
A triple bottom on the Gold (XAU/USD) 15-minute chart, bullish. The video shows how to spot it, where to enter and where the stop and target go.
- Pattern: Triple Bottom (bullish)
- Entry 4,152.73, stop 4,110.38, target 4,182.93

Full transcript
Can gold hold the line it just broke?
October 21, this is gold on the 15-minute chart, and the triple bottom confirmed yesterday.
A triple bottom is price holding at the same area again and again, then confirming when resistance gives way.
Here it looks like repeated dips into one support zone, with a close above the 4147.25 resistance band as confirmation.
From here, the measured target is 4182.93, and the invalidation level is 4110.38 on a close beyond it.
The setup remains open, and neither the target nor the invalidation level has been hit.
A pattern never guarantees its target, and the same shape fails just as often.
go dot borearis dot com.
Keep watching



AI-voiced; written and reviewed by the Borearis Research Team. For education only, not investment advice. Trading involves risk.