
形态解析
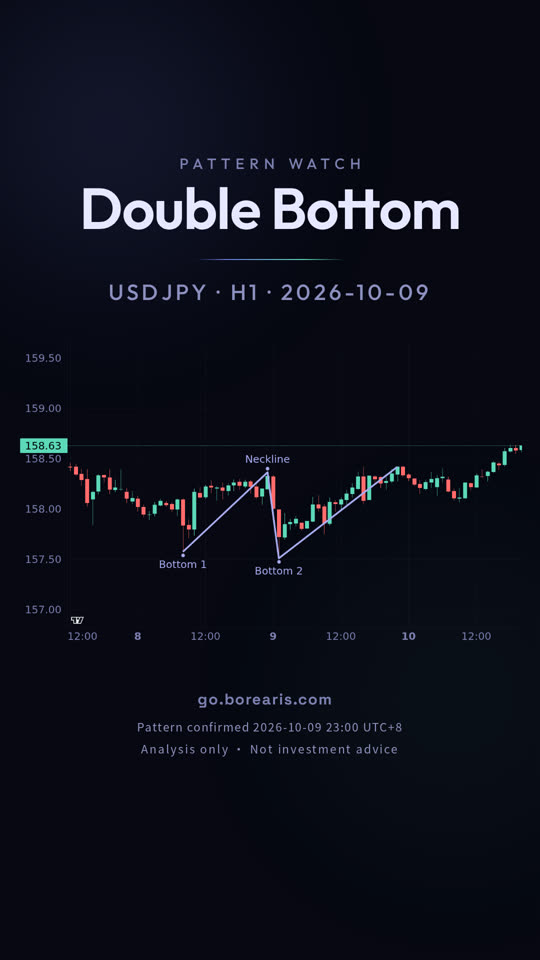
美元/日元 1 小时图:双底
美元/日元 1 小时图出现双底,看涨。视频一分钟看懂这个形态怎么认、在哪里进场、止损和目标放哪。
这则形态
- 形态:双底(看涨)
- 进场 158.41700、止损 157.47100、目标 159.21800


视频完整旁白(英文原文)
The dollar against the yen hit the same floor twice.
October 12, on the hourly dollar against the yen chart, a double bottom confirmed last Friday.
A double bottom is price holding twice at the same area, with a high in between.
That middle high is the neckline, and a close above it is what confirms the pattern.
The neckline is 158.363, and the measured target is 159.218.
The invalidation level is 157.471; a close below it cancels the pattern.
This pattern is still open, and neither the target nor the invalidation level has been hit yet.
A pattern never guarantees its target, and the same shape fails just as often.
go dot borearis dot com
更多短片
接着看
视频为 AI 配音,内容由 Borearis 研究团队撰写审核。仅供学习参考,不构成投资建议,交易有风险。