
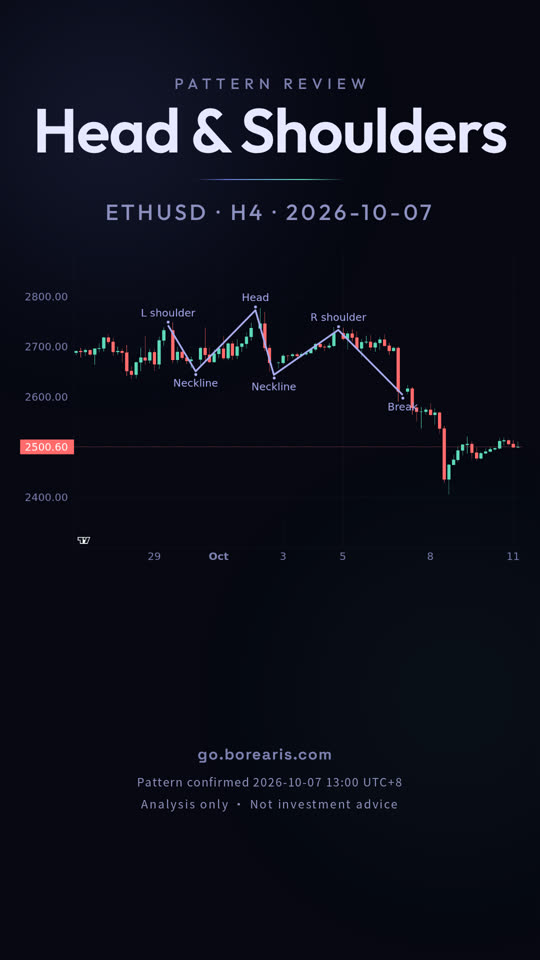
Ethereum (ETH/USD) 4-hour chart: Head & Shoulders
A head & shoulders on the Ethereum (ETH/USD) 4-hour chart, bearish. The video shows how to spot it, where to enter and where the stop and target go.
- Pattern: Head & Shoulders (bearish)
- Entry 2,603.76, stop 2,739.93, target 2,506.57
- Result: Hit target

Full transcript
Three highs sit across this chart, with the middle one clearly the tallest.
This is ETHUSD on the four hour timeframe, from October seventh to October eighth.
That shape is a head and shoulders top.
The two outer highs are lower and roughly level, and the lows beneath them form the neckline.
A close below that neckline is what confirms it, and price closed below 2634.01 on October seventh.
After that, it fell to the measured target at 2506.57 on October eighth, about 36 hours later, a 3.63 percent move.
The pattern does not guarantee the target. It worked this time, but the same shape often fails.
go dot borearis dot com.
Keep watching
AI-voiced; written and reviewed by the Borearis Research Team. For education only, not investment advice. Trading involves risk.