

视频完整旁白(英文原文)
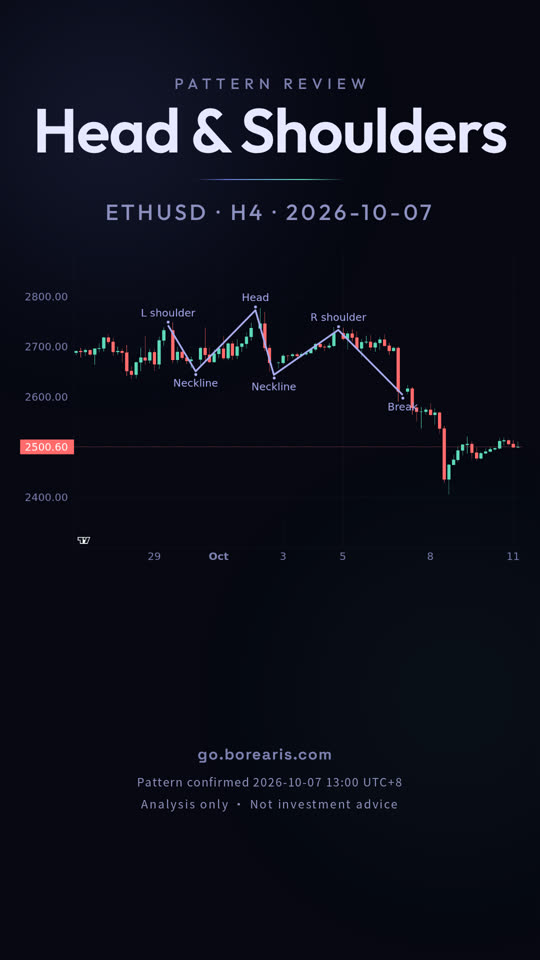
Three highs sit across this chart, with the middle one clearly the tallest.
This is ETHUSD on the four hour timeframe, from October seventh to October eighth.
That shape is a head and shoulders top.
The two outer highs are lower and roughly level, and the lows beneath them form the neckline.
A close below that neckline is what confirms it, and price closed below 2634.01 on October seventh.
After that, it fell to the measured target at 2506.57 on October eighth, about 36 hours later, a 3.63 percent move.
The pattern does not guarantee the target. It worked this time, but the same shape often fails.
go dot borearis dot com.
更多短片
接着看
视频为 AI 配音,内容由 Borearis 研究团队撰写审核。仅供学习参考,不构成投资建议,交易有风险。