WTI Crude Oil Bull flag 15 min

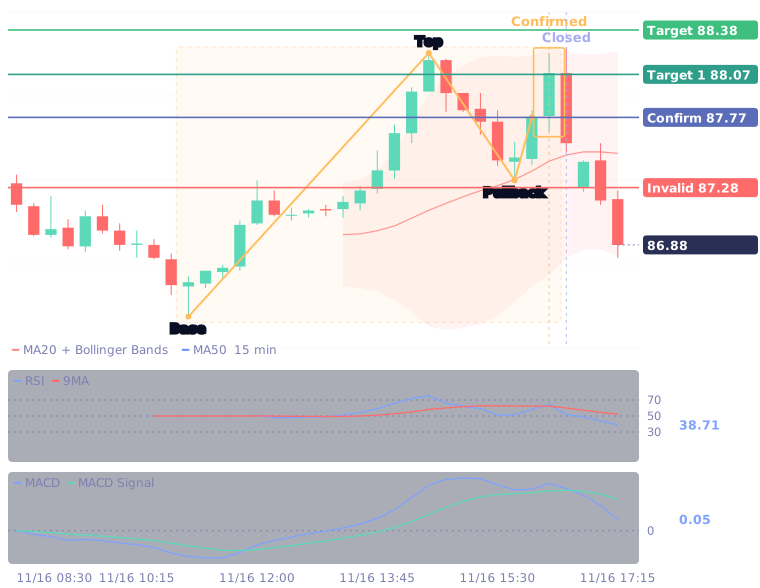
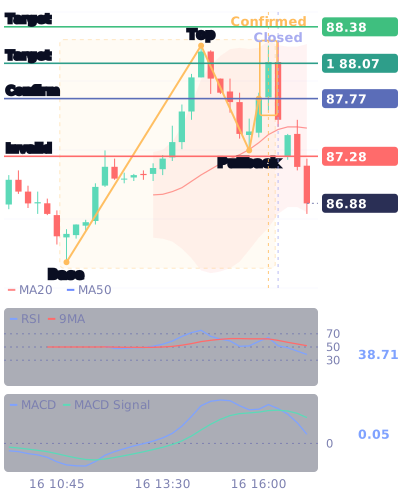
Gold line = the pattern's swing points; gold box = the confirmation candle; coloured lines = target and invalidation; blue = confirmation price.
Bull flag: First target, then break-even
What this tells you
A sharp rise followed by a small pullback; a break above the consolidation usually means the uptrend resumes.
← All chart patterns · Other patterns for this market · Key levels and research for this market · How to read patterns
Swing points
| Point | Time UTC+8 | Price |
|---|---|---|
| Pole base | Nov 16, 11:00 | 86.38 |
| Pole top | Nov 16, 14:30 | 88.22 |
| Pullback low | Nov 16, 15:45 | 87.33 |
| Confirmation | Nov 16, 16:15 | 87.77 |
Recently closed Bull flag patterns: 17 in total, 6 reached the target first (35%), 11 were invalidated and 0 expired. Results by pattern →
Chart patterns are technical reference points, not trade recommendations. Past results do not guarantee future outcomes; trading involves risk.
Live levels and price alerts in the app
The Borearis app has live levels for every market, price alerts, daily picks and AI analysis.