
Real or fake: which breakout held?
Two breakouts. One held, one failed. Pick the one that held before I show you.
- Real breakout: closes beyond the level and stays there.
- Fake breakout: closes back inside within a few candles.
- Never enter on a wick alone. Wait for the close.
- Two real Dow 4-hour charts: one closed back inside on the next candle, the other kept closing above and ran to 54,325.
The real chart used in this lesson
Real US30 4-hour charts · A: Aug 7 – Aug 13 · B: Jul 27 – Aug 4 · quiz: Aug 18 – Aug 19
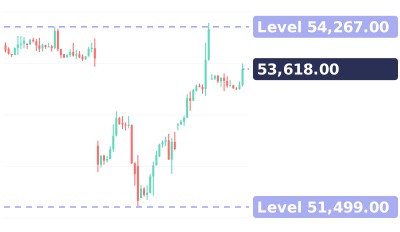
Quiz at the end: It just closed above its high. Buy now, wait, or skip?
Full transcript
Two breakouts. One held, one failed.
Pick the one that held before I show you.
Chart A, the Dow, 4-hour. A close above the range high, 54,126.
Chart B, also the Dow. A close above the high at 52,968.
A or B? Pick before the next candles show up.
Chart A: the next candle closed back inside. Fake.
Two days later, it was down at 53,654.
Chart B: the next candles stayed above. Real. It ran to 54,325.
Real breakouts close beyond and stay. Fake ones close back inside within a few candles.
And never enter on a wick alone. Wait for the close.
Save this. Closes beyond and stays: real. Back inside within a few candles: fake. Wick alone: no entry.
Your turn. This one just closed above its high. Buy now, wait, or skip? Comment below.
Follow for one chart lesson every day.
go dot borearis dot com.
Keep watching

AI-voiced; written and reviewed by the Borearis Research Team. For education only, not investment advice. Trading involves risk.