

這堂課用的真實 K 線
Real US30 4-hour charts · A: Aug 7 – Aug 13 · B: Jul 27 – Aug 4 · quiz: Aug 18 – Aug 19
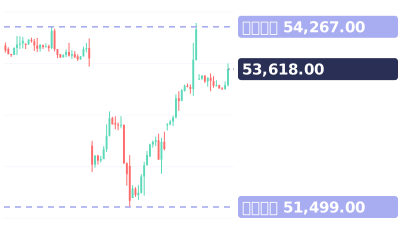
影片最後的小測驗:價格剛剛收在它的高點之上。現在該買進、再等等,還是不做?
影片完整旁白(英文原文)
Two breakouts. One held, one failed.
Pick the one that held before I show you.
Chart A, the Dow, 4-hour. A close above the range high, 54,126.
Chart B, also the Dow. A close above the high at 52,968.
A or B? Pick before the next candles show up.
Chart A: the next candle closed back inside. Fake.
Two days later, it was down at 53,654.
Chart B: the next candles stayed above. Real. It ran to 54,325.
Real breakouts close beyond and stay. Fake ones close back inside within a few candles.
And never enter on a wick alone. Wait for the close.
Save this. Closes beyond and stays: real. Back inside within a few candles: fake. Wick alone: no entry.
Your turn. This one just closed above its high. Buy now, wait, or skip? Comment below.
Follow for one chart lesson every day.
go dot borearis dot com.
接著看

影片為 AI 配音,內容由 Borearis 研究團隊撰寫審核。僅供學習參考,不構成投資建議,交易有風險。