
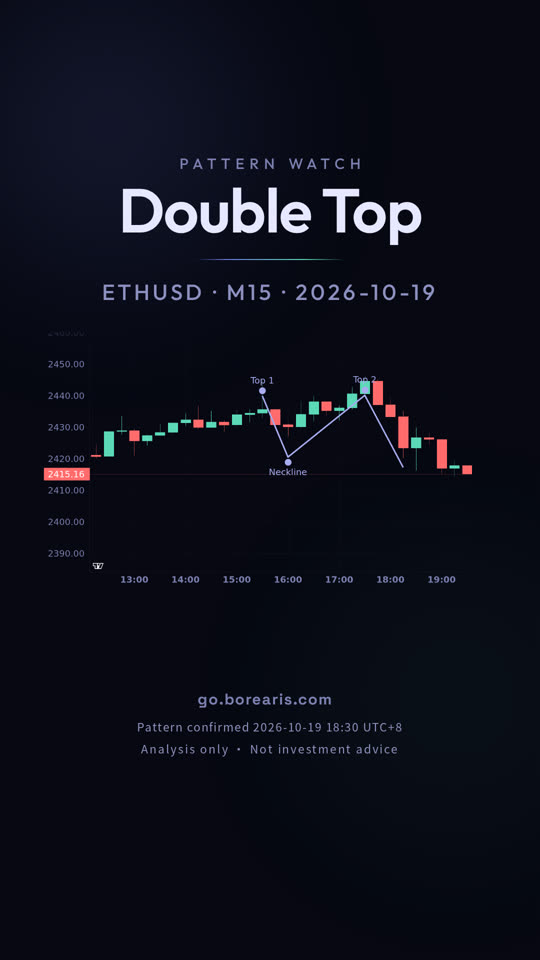
Ethereum (ETH/USD) 15-minute chart: Double Top
A double top on the Ethereum (ETH/USD) 15-minute chart, bearish. The video shows how to spot it, where to enter and where the stop and target go.
- Pattern: Double Top (bearish)
- Entry 2,417.26, stop 2,441.55, target 2,400.98

Full transcript
Ether hit the same area twice, with a dip in between.
October 19, this is Ether on the 15-minute chart, and the double top confirmed today.
A double top is price rejected twice from the same area. It looks like two pushes up into one zone, with a low between them. The low between them is the neckline, and confirmation comes only on a close below 2420.55.
From here, the measured target is 2400.98. The invalidation level is 2441.55, so a close beyond it cancels the pattern. It is still in play, and neither level has been hit.
A pattern never guarantees its target, and the same shape fails just as often.
go dot borearis dot com.
Keep watching

AI-voiced; written and reviewed by the Borearis Research Team. For education only, not investment advice. Trading involves risk.