
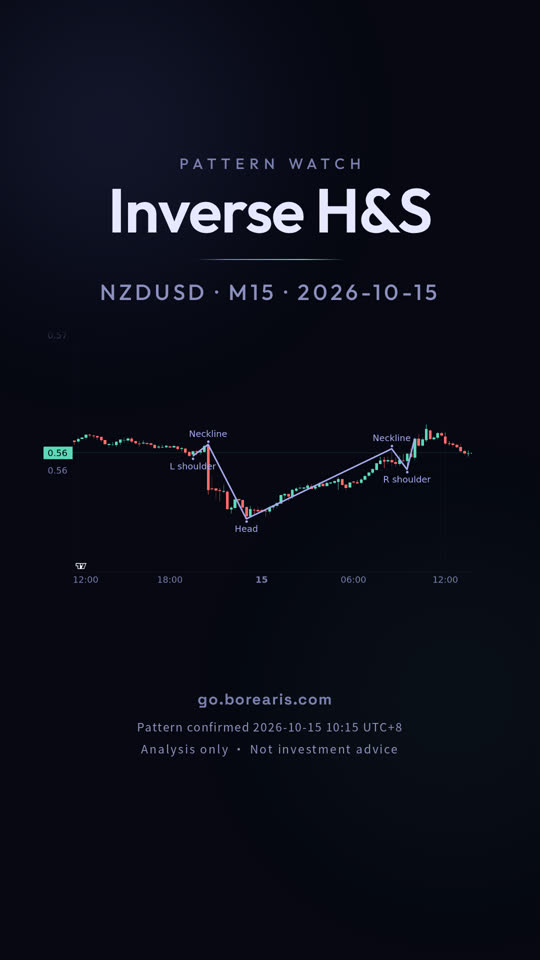
NZD/USD 15-minute chart: Inverse H&S
A inverse h&s on the NZD/USD 15-minute chart, bullish. The video shows how to spot it, where to enter and where the stop and target go.
- Pattern: Inverse H&S (bullish)
- Entry 0.56235, stop 0.55993, target 0.56700


Full transcript
Can the New Zealand dollar hold the line it just broke?
October 15: The New Zealand dollar on the 15 minute chart confirmed an inverse head and shoulders today.
This pattern is three lows, with the middle low lowest and the two outer lows higher and roughly level. Connect the two highs to draw the neckline. It confirms only on a close above that neckline.
The neckline sits at 0.56156. The measured target is 0.567, and the invalidation level is 0.55993.
The setup is still in play: neither the target nor the invalidation level has been hit yet.
A pattern never guarantees its target, and the same shape fails just as often.
go dot borearis dot com.
Keep watching
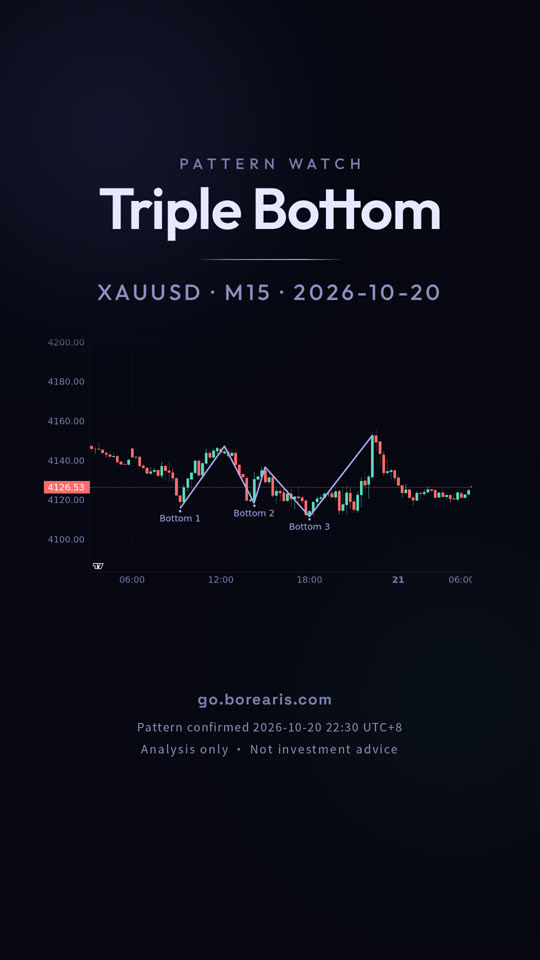
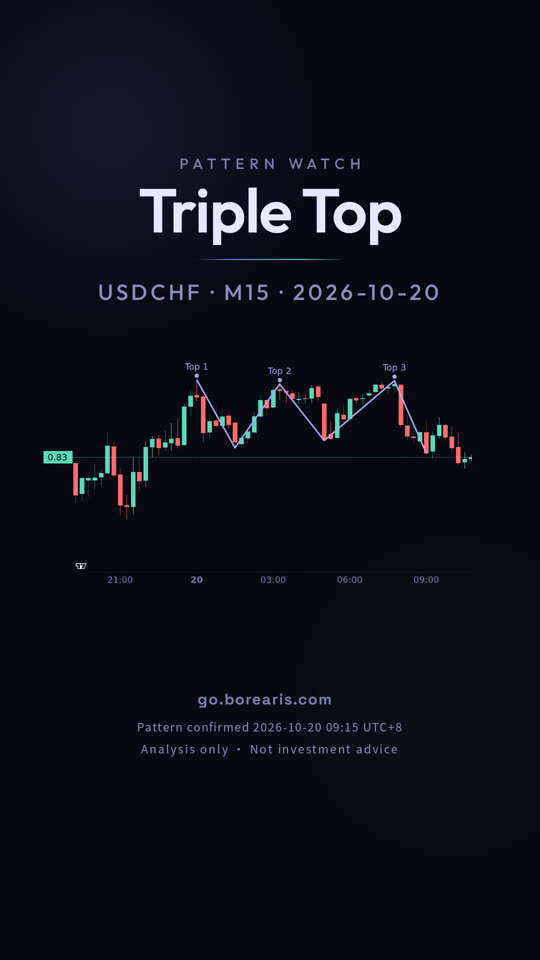
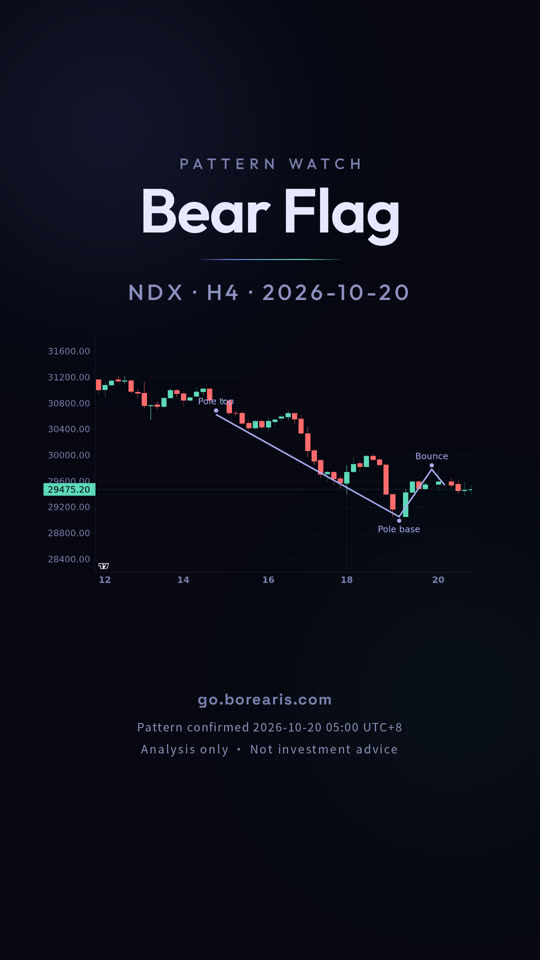
AI-voiced; written and reviewed by the Borearis Research Team. For education only, not investment advice. Trading involves risk.