
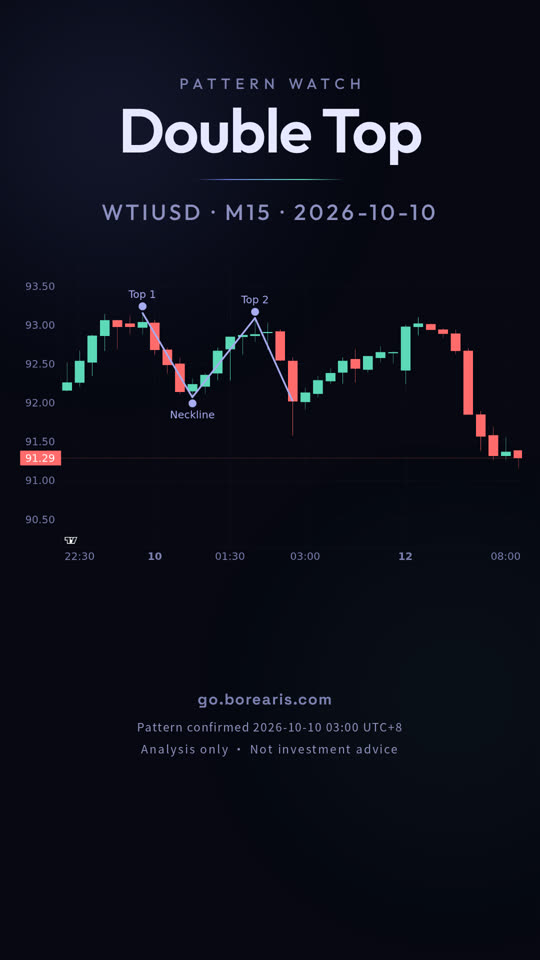
WTI Crude Oil 15-minute chart: Double Top
A double top on the WTI Crude Oil 15-minute chart, bearish. The video shows how to spot it, where to enter and where the stop and target go.
- Pattern: Double Top (bearish)
- Entry 92.02, stop 93.24, target 90.98

Full transcript
Hi everyone, today is October 12.
Price got rejected twice near the same ceiling, and the line underneath just broke.
This is WTI crude, ticker WTIUSD, on the 15 minute chart, and the double top confirmed last Saturday.
A double top is price rejected twice from the same area.
On this chart, it looks like two pushes up into the same zone, with a low between them.
That low is the neckline at 92.07, and confirmation comes only on a close below it.
The measured target is 90.98, and the invalidation level is 93.24.
The pattern is still in play, and neither level has been hit yet.
A pattern never guarantees its target, and the same shape fails just as often.
go dot borearis dot com.
Keep watching
AI-voiced; written and reviewed by the Borearis Research Team. For education only, not investment advice. Trading involves risk.