
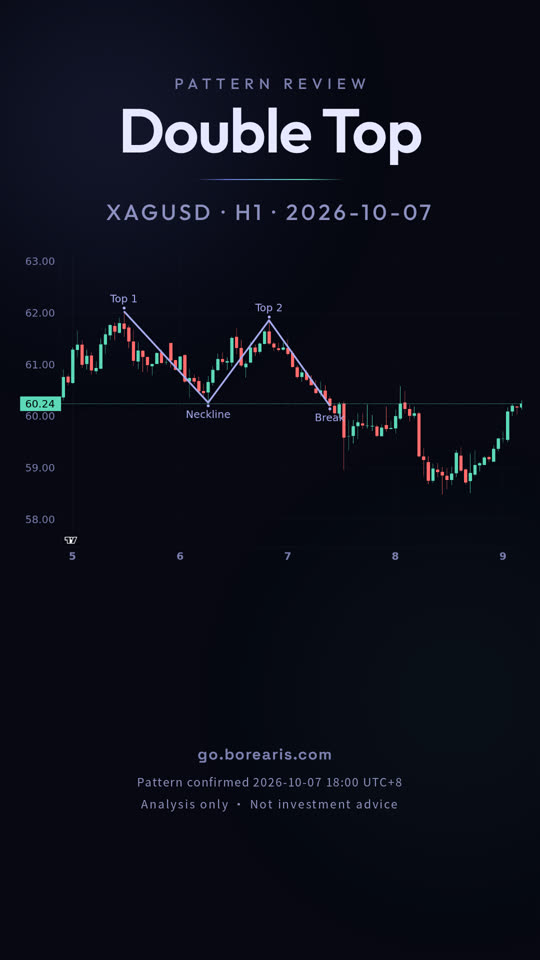
Silver (XAG/USD) 1-hour chart: Double Top
A double top on the Silver (XAG/USD) 1-hour chart, bearish. The video shows how to spot it, where to enter and where the stop and target go.
- Pattern: Double Top (bearish)
- Entry 60.20, stop 62.10, target 58.49
- Result: Hit target

Full transcript
Two pushes into the same ceiling, with a low sitting between them.
This chart is spot silver, XAGUSD, on the one hour timeframe, dated October seventh.
That shape is a double top: price gets rejected twice from the same area. The two highs sit close together, and the low between them forms the neckline. Confirmation only came when price closed below that neckline, at 60.262.
After that close, price slid, and on October eighth it reached the measured target at 58.492. That was about 25 hours later, a move of 2.79 percent.
This pattern does not guarantee the target. It worked this time, but the same shape often fails.
Go dot borearis dot com.
Keep watching
AI-voiced; written and reviewed by the Borearis Research Team. For education only, not investment advice. Trading involves risk.