
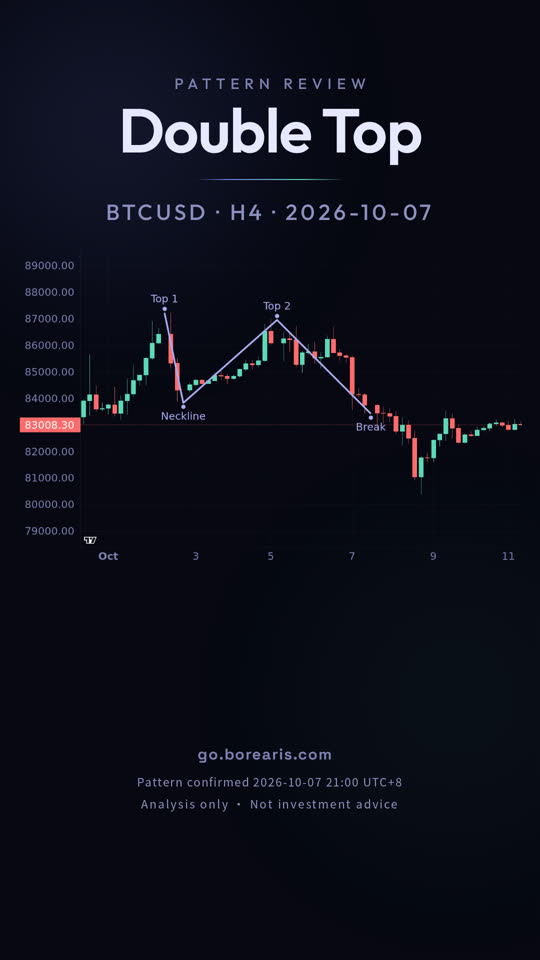
Bitcoin (BTC/USD) 4-hour chart: Double Top
A double top on the Bitcoin (BTC/USD) 4-hour chart, bearish. The video shows how to spot it, where to enter and where the stop and target go.
- Pattern: Double Top (bearish)
- Entry 83,417.10, stop 87,403.00, target 80,431.30
- Result: Hit target

Full transcript
Two peaks sit at the top, with a clear valley between them.
This is BTCUSD on the 4-hour chart, confirmed on October 7.
A double top is price rejected twice from the same area.
It looks like an M, two peaks at roughly the same height with a dip in the middle.
That dip is the neckline.
The pattern only confirms when price closes below the neckline, not when it touches it.
Here, price closed below 83826.3, and the measured move began.
After confirmation, price continued lower and reached 80431.3 on October 9.
That target came 32 hours later, a 3.48% move.
The pattern does not guarantee the target; it worked this time, but the same shape often fails.
go dot borearis dot com.
Keep watching
AI-voiced; written and reviewed by the Borearis Research Team. For education only, not investment advice. Trading involves risk.