

影片完整旁白(英文原文)
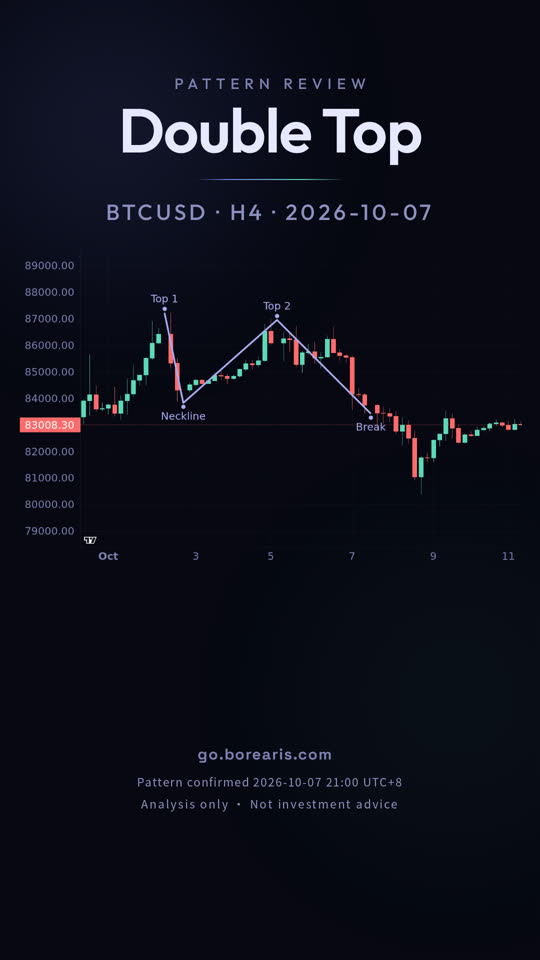
Two peaks sit at the top, with a clear valley between them.
This is BTCUSD on the 4-hour chart, confirmed on October 7.
A double top is price rejected twice from the same area.
It looks like an M, two peaks at roughly the same height with a dip in the middle.
That dip is the neckline.
The pattern only confirms when price closes below the neckline, not when it touches it.
Here, price closed below 83826.3, and the measured move began.
After confirmation, price continued lower and reached 80431.3 on October 9.
That target came 32 hours later, a 3.48% move.
The pattern does not guarantee the target; it worked this time, but the same shape often fails.
go dot borearis dot com.
更多短片
接著看
影片為 AI 配音,內容由 Borearis 研究團隊撰寫審核。僅供學習參考,不構成投資建議,交易有風險。