UBER Double bottom 15 min
UBER 15 minConfirmed Nov 14, 05:00 UTC+8
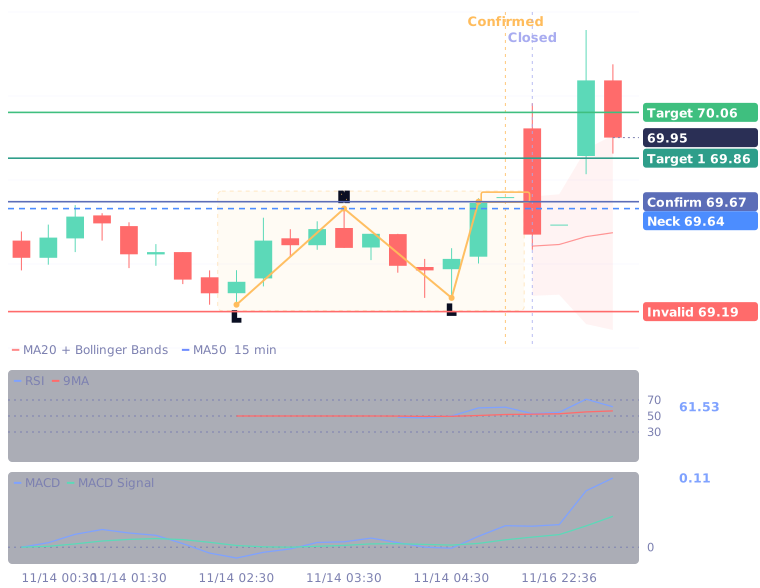
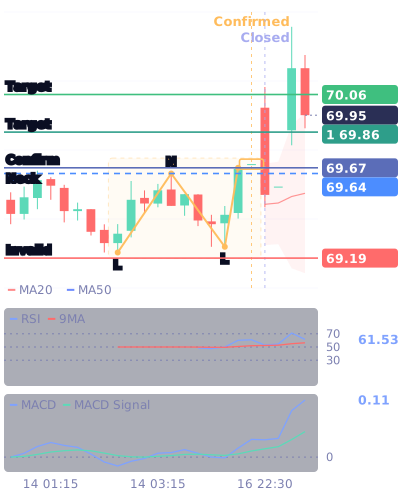
Gold line = the pattern's swing points; gold box = the confirmation candle; coloured lines = target and invalidation; blue = confirmation price.
Double bottom: Target hit
Target70.06
First target69.86
Confirmation69.67
Invalid at69.19
Move+0.53%
Timeframe15 min
ConfirmedNov 14, 05:00
ClosedNov 16, 22:30
Duration65.8 h
Reward / risk0.83
What this tells you
Price finds support twice at a similar low; a break above the high between them (the neckline) often marks a turn from down to up.
Swing points
| Point | Time UTC+8 | Price |
|---|---|---|
| Low | Nov 14, 02:30 | 69.22 |
| Neckline | Nov 14, 03:30 | 69.64 |
| Low | Nov 14, 04:30 | 69.25 |
| Confirmation | Nov 14, 05:00 | 69.67 |
Recently closed Double bottom patterns: 16 in total, 15 reached the target first (94%), 1 were invalidated and 0 expired. Results by pattern →
Chart patterns are technical reference points, not trade recommendations. Past results do not guarantee future outcomes; trading involves risk.
Live levels and price alerts in the app
The Borearis app has live levels for every market, price alerts, daily picks and AI analysis.