
Find the support in 3 seconds. 3 clues to spot it fast
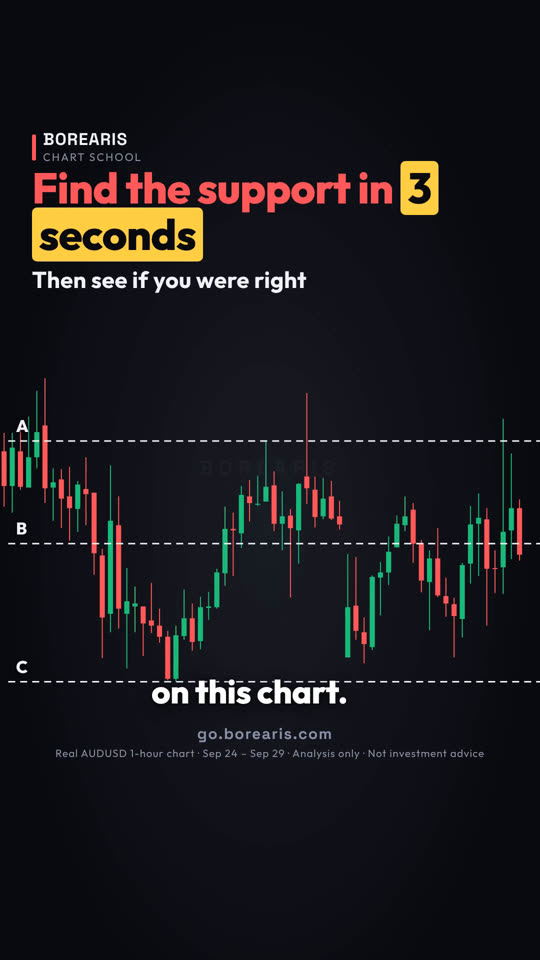
Find the support on this chart. You have three seconds. Ready? Here's where price actually bounced.
- Repeated reactions: price drops to the same area and bounces again and again.
- Wicks cluster: long lower wicks stopping at one price = a floor.
- Round numbers help: orders tend to gather near them.
- Draw support as a zone, not a razor-thin line.


The real chart used in this lesson
Real AUDUSD 1-hour chart · Sep 24 – Sep 29
Quiz at the end: How many clues do you need before you trust a support: one, two, or three?
Full transcript
Find the support on this chart. You have three seconds.
Ready? Here's where price actually bounced.
Line C, right around 0.7003. Did you get it?
Here's how to spot it fast. Three clues.
Clue one: repeated reactions. Price dropped here three times, and bounced every time.
One touch could be luck. Repeated touches make it a level.
Clue two: wicks cluster at the same price.
A long lower wick means sellers pushed price down, and buyers pushed it right back up.
When several wicks stop at one price, that's your floor.
Clue three: round numbers help.
This floor sat just above 0.70. Orders tend to gather near round numbers.
And draw support as a zone, not a razor-thin line. Wicks rarely stop at the exact same price.
Save this. Repeated reactions. Wicks clustering. A round number nearby. The more clues, the stronger the level.
Your turn. How many clues do you need before you trust a support? One, two, or three? Comment below.
Follow for one chart lesson every day.
go dot borearis dot com.
Keep watching




AI-voiced; written and reviewed by the Borearis Research Team. For education only, not investment advice. Trading involves risk.