
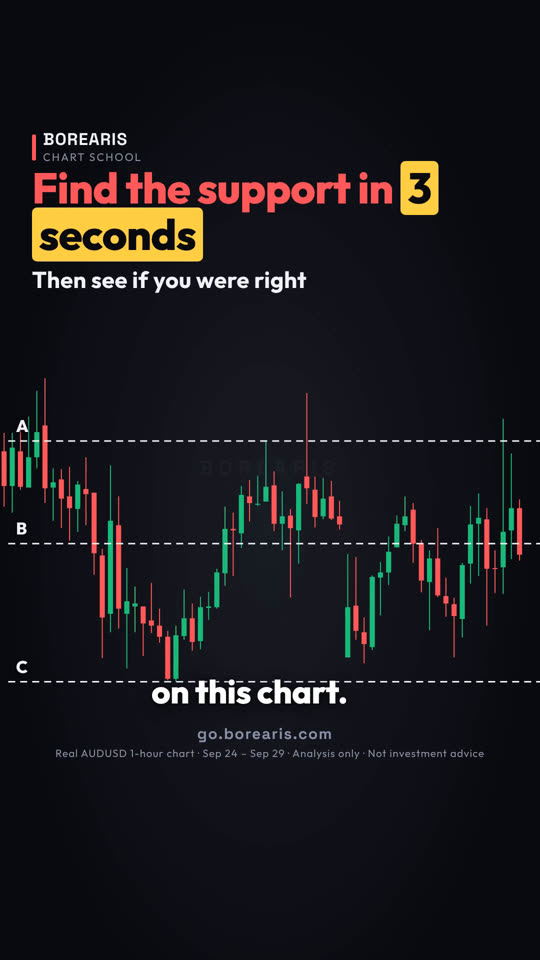
3 秒内找出支撑
三秒内找出这张图的支撑。准备好了吗?这是价格实际反弹的地方。
- 反复反应:价格跌到同一区域,一次又一次反弹。
- 影线聚集:长下影线停在同一价位 = 地板。
- 整数价位有帮助:订单通常会聚集在附近。
- 把支撑画成一个区域,不是一条细线。


这堂课用的真实 K 线
Real AUDUSD 1-hour chart · Sep 24 – Sep 29
视频最后的小测验:你要几个线索才敢相信一个支撑:一个、两个,还是三个?
视频完整旁白(英文原文)
Find the support on this chart. You have three seconds.
Ready? Here's where price actually bounced.
Line C, right around 0.7003. Did you get it?
Here's how to spot it fast. Three clues.
Clue one: repeated reactions. Price dropped here three times, and bounced every time.
One touch could be luck. Repeated touches make it a level.
Clue two: wicks cluster at the same price.
A long lower wick means sellers pushed price down, and buyers pushed it right back up.
When several wicks stop at one price, that's your floor.
Clue three: round numbers help.
This floor sat just above 0.70. Orders tend to gather near round numbers.
And draw support as a zone, not a razor-thin line. Wicks rarely stop at the exact same price.
Save this. Repeated reactions. Wicks clustering. A round number nearby. The more clues, the stronger the level.
Your turn. How many clues do you need before you trust a support? One, two, or three? Comment below.
Follow for one chart lesson every day.
go dot borearis dot com.
接着看




视频为 AI 配音,内容由 Borearis 研究团队撰写审核。仅供学习参考,不构成投资建议,交易有风险。