
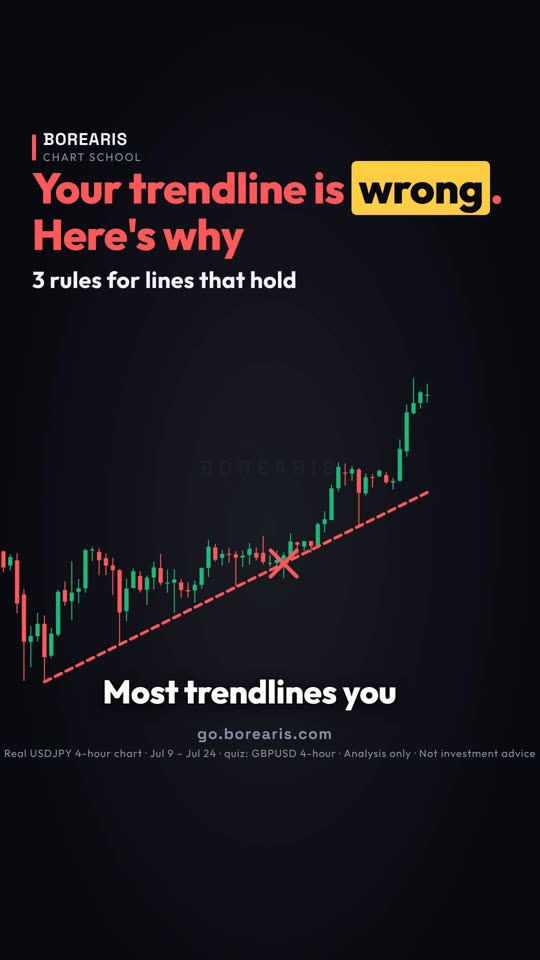
Your trendline is wrong. Here's why
Most trendlines you see are drawn wrong. Draw it like this, and price starts respecting it.
- Connect two real swing lows. The third touch confirms the line.
- Use wicks or bodies, never mix them.
- If the line cuts through candles, it's not a line. Delete it.
- A clean line touches the candles, it never runs through them.


The real chart used in this lesson
Real USDJPY 4-hour chart · Jul 9 – Jul 24 · quiz: GBPUSD 4-hour
Quiz at the end: Is this pound trendline valid: yes, no, or not yet?
Full transcript
Most trendlines you see are drawn wrong.
Draw it like this, and price starts respecting it.
Rule one. Connect two swing lows. Real turning points, not random candles.
On this dollar yen chart, that's the low on July 10, and the low on July 14.
Two points only draw a line. The third touch is what confirms it.
Price came back on July 20, touched the line, and bounced. Now the line is real.
Rule two. Pick wicks or bodies, and never mix them.
This line uses the wicks at every touch. Switch to a body for one point, and the line tilts.
Rule three. If the line cuts through candles, it's not a line.
This one skips a low, and slices right through this candle. Delete it.
A clean line touches the candles. It never runs through them.
Save this. Two swing lows to draw it. A third touch to confirm it. Wicks or bodies, never both. No cutting through candles.
Your turn. Is this pound trendline valid? Yes, no, or not yet? Comment below.
Follow for one chart lesson every day.
go dot borearis dot com.
Keep watching




AI-voiced; written and reviewed by the Borearis Research Team. For education only, not investment advice. Trading involves risk.