
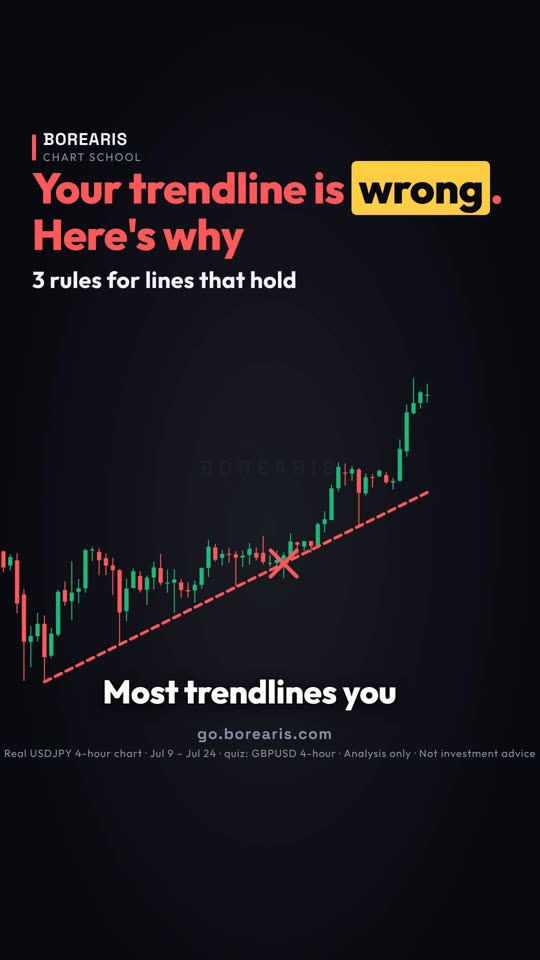
你的趨勢線畫錯了,原因在這
你看到的趨勢線大多畫錯了。照這樣畫,價格才會尊重它。
- 連接兩個真實的波段低點。第三次觸碰才確認這條線。
- 用影線或用實體,絕對不要混用。
- 如果線穿過 K 線,就不是線。刪掉它。
- 乾淨的線會碰到 K 線,絕不會穿過它們。


這堂課用的真實 K 線
Real USDJPY 4-hour chart · Jul 9 – Jul 24 · quiz: GBPUSD 4-hour
影片最後的小測驗:這條英鎊趨勢線有效嗎:有效、無效,還是還沒?
影片完整旁白(英文原文)
Most trendlines you see are drawn wrong.
Draw it like this, and price starts respecting it.
Rule one. Connect two swing lows. Real turning points, not random candles.
On this dollar yen chart, that's the low on July 10, and the low on July 14.
Two points only draw a line. The third touch is what confirms it.
Price came back on July 20, touched the line, and bounced. Now the line is real.
Rule two. Pick wicks or bodies, and never mix them.
This line uses the wicks at every touch. Switch to a body for one point, and the line tilts.
Rule three. If the line cuts through candles, it's not a line.
This one skips a low, and slices right through this candle. Delete it.
A clean line touches the candles. It never runs through them.
Save this. Two swing lows to draw it. A third touch to confirm it. Wicks or bodies, never both. No cutting through candles.
Your turn. Is this pound trendline valid? Yes, no, or not yet? Comment below.
Follow for one chart lesson every day.
go dot borearis dot com.
接著看




影片為 AI 配音,內容由 Borearis 研究團隊撰寫審核。僅供學習參考,不構成投資建議,交易有風險。