
Full transcript
Amazon looks quiet, but a key line just gave way.
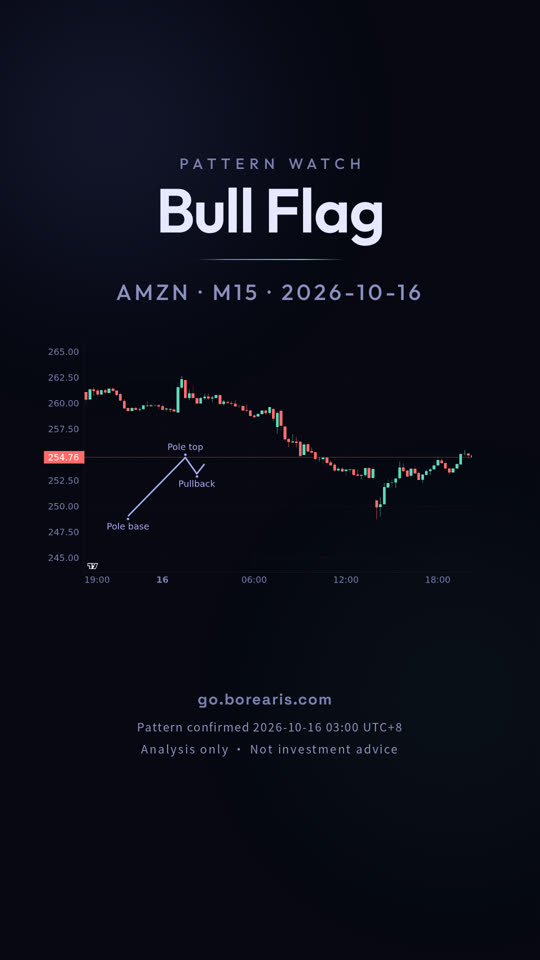
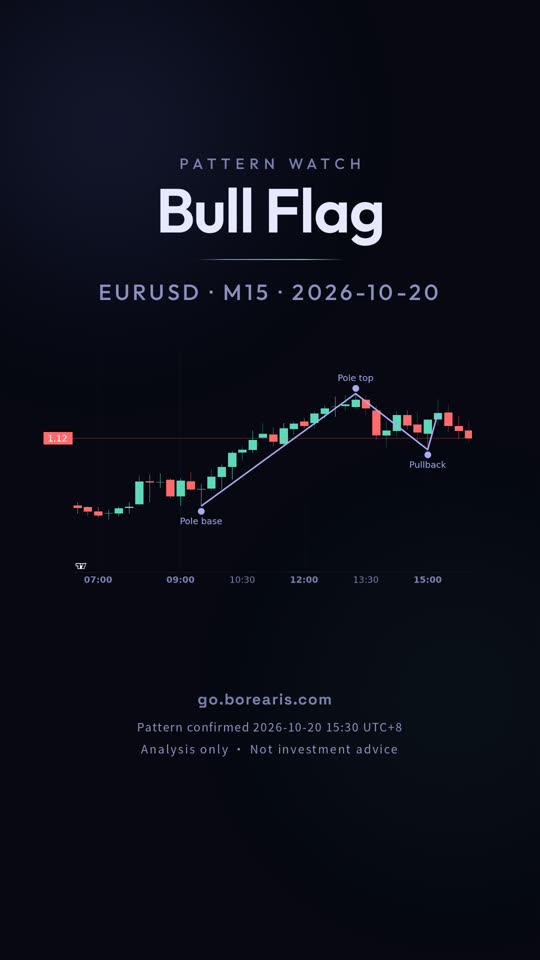
October 16, this is Amazon on the 15 minute chart, and a bull flag confirmed today.
A bull flag is a sharp rally, then a shallow drift lower.
It formed after a quick advance and a quiet pullback.
Confirmation came when price closed above the upper rail at 253.39.
From here, two levels frame the setup.
The measured target is 255.98, and invalidation is 252.98.
A close beyond invalidation would cancel the pattern.
The pattern is still open, and neither level has been hit.
A pattern never guarantees its target, and the same shape fails just as often.
go dot borearis dot com
MORE LESSONS
Keep watching
AI-voiced; written and reviewed by the Borearis Research Team. For education only, not investment advice. Trading involves risk.