
Full transcript
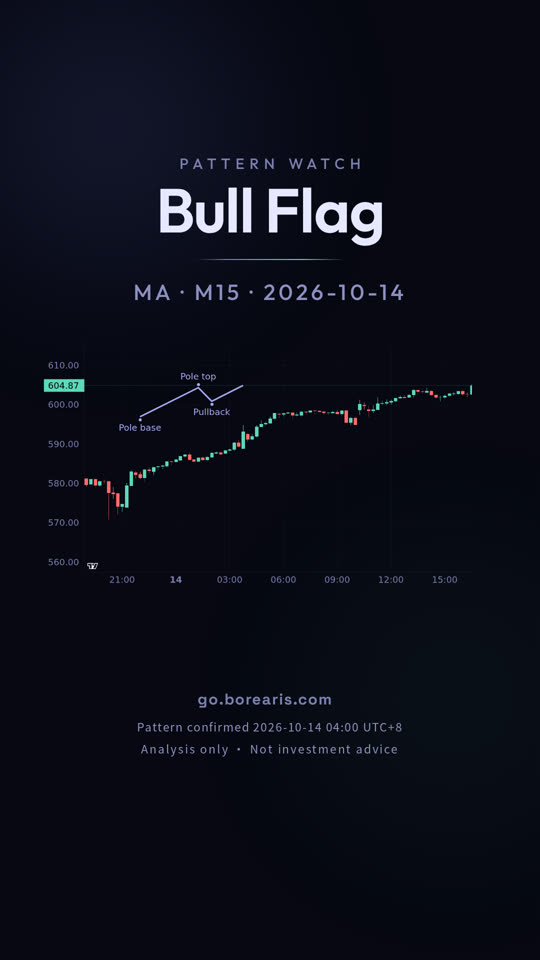
Mastercard jumped, then drifted lower in a tight, quiet slide.
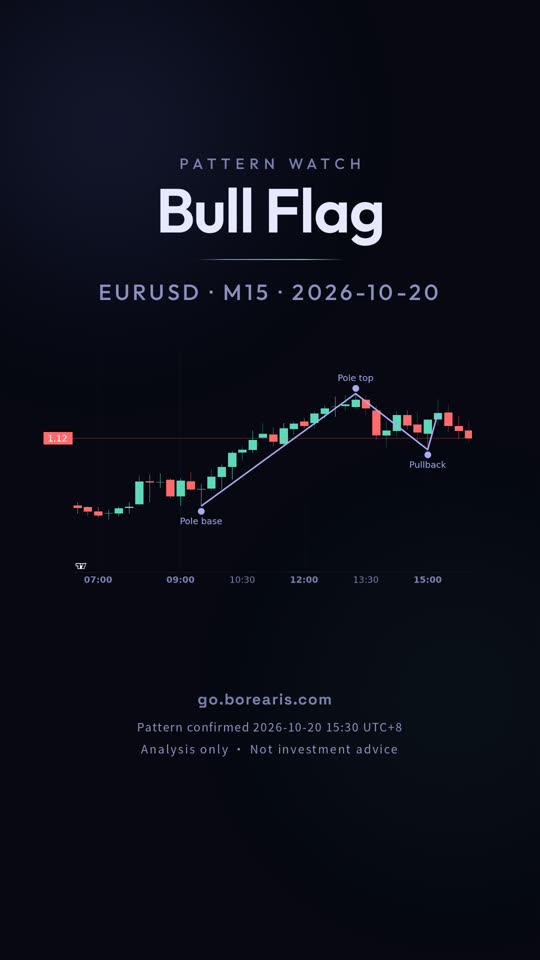
October 14: this is Mastercard on the 15-minute timeframe, and a bull flag confirmed today.
A bull flag is a sharp rally, then a shallow drift lower, confirmed when price breaks the upper rail of that drift.
Here, price rallied, eased back, then closed above the upper rail at 603.04.
That close above 603.04 confirmed the pattern.
From here, the measured target is 607.31, and the invalidation level is 600.59.
A close below 600.59 would cancel it.
The pattern is still in play, and neither level has been hit yet.
A pattern never guarantees its target, and the same shape fails just as often.
go dot borearis dot com.
Keep watching
AI-voiced; written and reviewed by the Borearis Research Team. For education only, not investment advice. Trading involves risk.