
Full transcript
The S and P surged, then went almost silent.
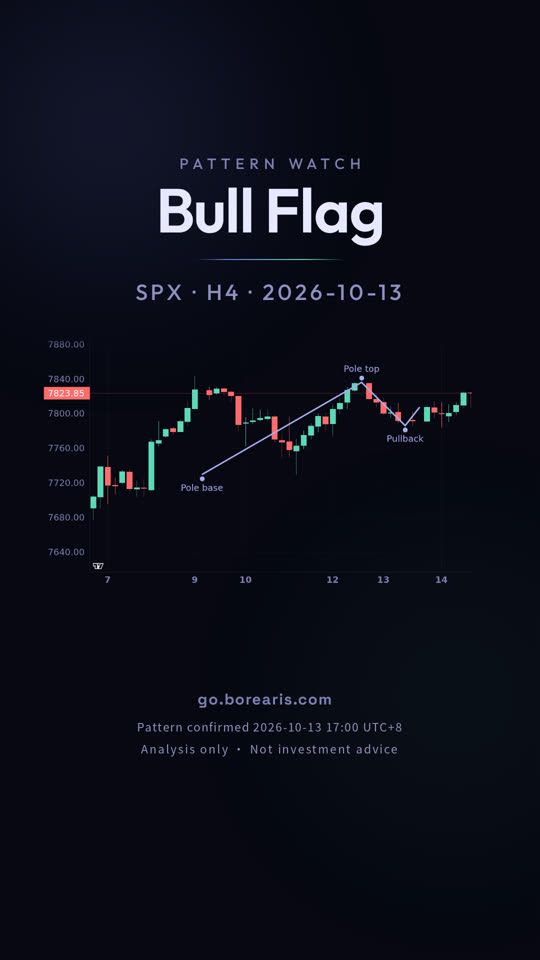
October 14. This is the S and P 500 on the 4-hour chart, and the bull flag confirmed yesterday.
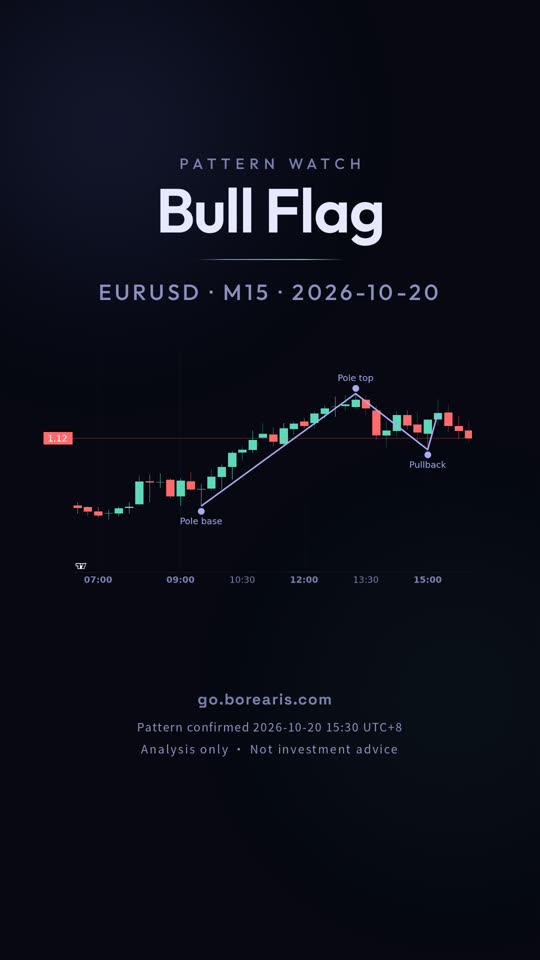
A bull flag is a sharp rally, then a shallow drift lower.
Here the rally was steep and the drift stayed tight which is what gives the shape its name.
Confirmation came when price closed above the upper rail at 7795.7.
The measured target is 7842.5 and the invalidation level is 7781.5.
It is still in play and neither level has been hit.
A pattern never guarantees its target, and the same shape fails just as often.
go dot borearis dot com.
MORE LESSONS
Keep watching
AI-voiced; written and reviewed by the Borearis Research Team. For education only, not investment advice. Trading involves risk.