
Trading without a stop? One candle can end it
No stop loss? It's fine, until one candle changes everything. Here's what a single bad hour can do.
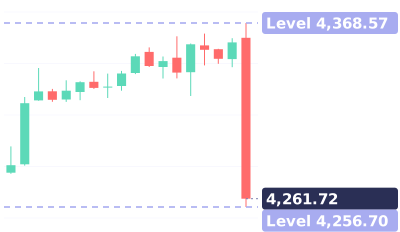
- Real gold chart, Sep 17: one hourly candle went from about 4360 to 4257.
- Buy 0.1 lots at 4355 with no stop: about −$980 at the low. On $5,000, about 20% in one hour.
- Same trade with a stop at 4340: $150 of risk, 3% of the account. Fast moves can slip a bit.
- A stop caps the damage. Set it before you enter, every time.

The real chart used in this lesson
Real XAUUSD 1-hour chart · Sep 16 – Sep 17
Quiz at the end: Do you always use a stop: always, sometimes, or never?
Full transcript
No stop loss? It's fine, until one candle changes everything.
Here's what a single bad hour can do.
Real gold chart, September 17. You buy 0.1 lots at 4355. No stop.
Gold, 1 standard lot: price moves 1 dollar, that's 100 dollars. At 0.1 lots, 10.
The next hour opens near 4360. Then it drops to 4257 before the hour ends.
That's about 98 dollars of price against you. Down about 980 dollars.
On a 5,000 dollar account, that's about 20 percent, in one hour.
One candle wiped out the whole day's rise. In a move like this, there's little time to react.
Now the same trade, with a stop at 4340, under the last lows.
Risk: 15 dollars of price, 150 dollars. That's 3 percent of the account.
The candle takes out your stop. A fast move can slip a bit past it, but you're out.
Same candle. About 980 without a stop. About 150 with one.
A stop caps the damage you can take. Set it before you enter, every time.
Save this. Big moves come fast. A stop caps the damage. Set it before entry, every time.
Your turn. Do you always use a stop? Always, sometimes, or never? Comment below.
Follow for one chart lesson every day.
go dot borearis dot com.
Keep watching



AI-voiced; written and reviewed by the Borearis Research Team. For education only, not investment advice. Trading involves risk.