
Bull flag: real or fake? Run the 3 checks
This looks like a bull flag. Is it real? Run it through three quick checks.
- Check 1: a strong pole. Fast move, mostly green candles.
- Check 2: a shallow, tight flag. It gives back less than half of the pole.
- Check 3: a candle closes above the flag. A wick alone doesn't count.
- All three pass: buy the close, stop under the flag's low. Miss one: skip it.


The real chart used in this lesson
Real GBPUSD 1-hour chart · Oct 19 – Oct 21
Quiz at the end: Strong pole, but the flag gave back most of it. Real, fake, or wait?
Full transcript
This looks like a bull flag. Is it real?
Run it through three quick checks.
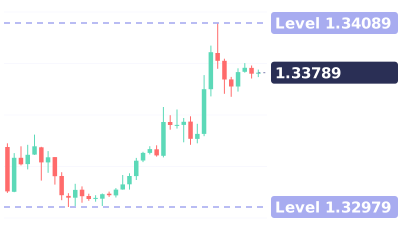
Check one: a strong pole. On this one-hour pound chart, price ran from 1.3299 to 1.3358 in nine hours.
Eight of those ten candles closed green. That's a strong pole.
Check two: a shallow, tight flag. The pullback gave back less than half of the pole.
Five small candles, drifting sideways. Sellers couldn't push it down.
Check three: a close above the flag. This candle closed at 1.3369, above the flag's top.
Three checks, three passes. So the answer: real.
Here's what happened. Two candles later, price hit 1.3409.
The entry: buy the close above the flag. Stop under the flag's low, at 1.3335.
So what does a fake look like? It fails at least one check.
A weak, choppy pole. Or a flag that gives back more than half of the pole.
Or a wick pokes above the flag, but the candle closes back inside. No close, no trade.
Save this. Strong pole. Shallow, tight flag. Close above the flag. All three: real. Miss one: skip it.
Your turn. Strong pole, but the flag gave back most of it. Real, fake, or wait? Comment below.
Follow for one chart lesson every day.
go dot borearis dot com.
Keep watching



AI-voiced; written and reviewed by the Borearis Research Team. For education only, not investment advice. Trading involves risk.