
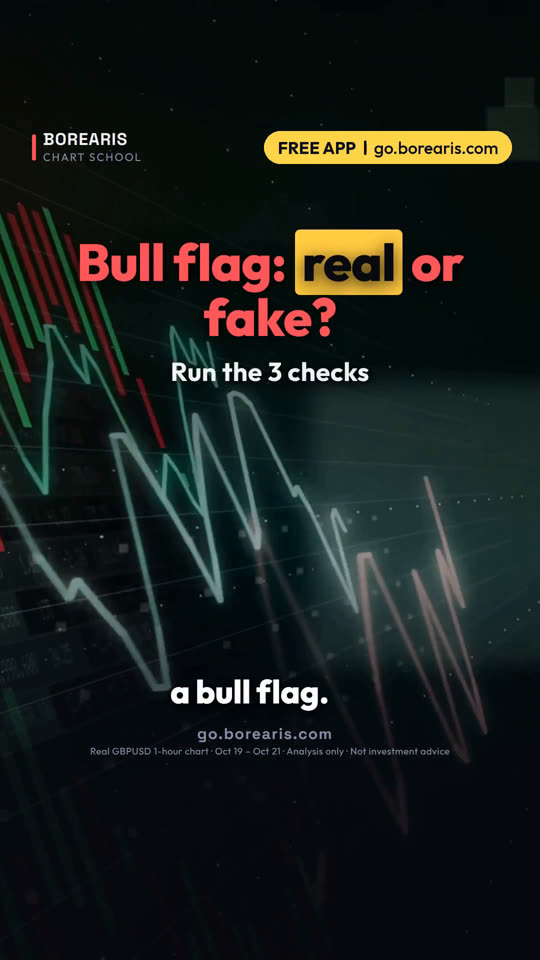
看涨旗形:真的还是假的?
这看起来像看涨旗形,是真的吗?用三个快速检查跑一遍。
- 检查一:强势旗杆。走势快速,多数是阳线。
- 检查二:浅而窄的旗形。回吐幅度不到旗杆的一半。
- 检查三:有 K 线收在旗形之上。只有影线不算。
- 三项全部通过:收盘价买入,止损放在旗形低点之下。少一项:跳过不做。


这堂课用的真实 K 线
Real GBPUSD 1-hour chart · Oct 19 – Oct 21
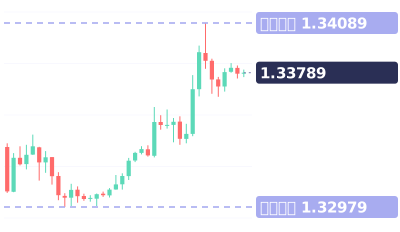
视频最后的小测验:旗杆很强,但旗形回吐了大部分涨幅。是真突破、假突破,还是再等等?
视频完整旁白(英文原文)
This looks like a bull flag. Is it real?
Run it through three quick checks.
Check one: a strong pole. On this one-hour pound chart, price ran from 1.3299 to 1.3358 in nine hours.
Eight of those ten candles closed green. That's a strong pole.
Check two: a shallow, tight flag. The pullback gave back less than half of the pole.
Five small candles, drifting sideways. Sellers couldn't push it down.
Check three: a close above the flag. This candle closed at 1.3369, above the flag's top.
Three checks, three passes. So the answer: real.
Here's what happened. Two candles later, price hit 1.3409.
The entry: buy the close above the flag. Stop under the flag's low, at 1.3335.
So what does a fake look like? It fails at least one check.
A weak, choppy pole. Or a flag that gives back more than half of the pole.
Or a wick pokes above the flag, but the candle closes back inside. No close, no trade.
Save this. Strong pole. Shallow, tight flag. Close above the flag. All three: real. Miss one: skip it.
Your turn. Strong pole, but the flag gave back most of it. Real, fake, or wait? Comment below.
Follow for one chart lesson every day.
go dot borearis dot com.
接着看

视频为 AI 配音,内容由 Borearis 研究团队撰写审核。仅供学习参考,不构成投资建议,交易有风险。