
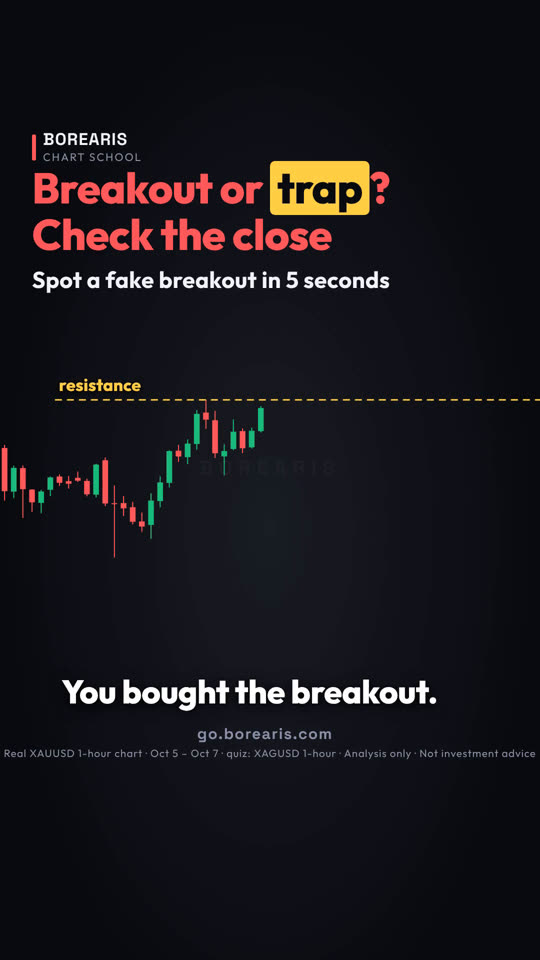
Breakout or trap? Check the close
You bought the breakout. Then it dropped right back. That was a fake breakout. Here's how to spot one before you buy.
- Wick above the level, close back inside = fake breakout. Don't chase it.
- Real breakout: the candle body closes beyond the level.
- Then the next candle holds above it.
- Wait for the close, not the wick.

The real chart used in this lesson
Real XAUUSD 1-hour chart · Oct 5 – Oct 7 · quiz: XAGUSD 1-hour
Quiz at the end: This silver candle broke the high. Real, fake, or wait?
Full transcript
You bought the breakout. Then it dropped right back.
That was a fake breakout. Here's how to spot one before you buy.
Look at this gold chart. The high was around 4180.
Then this candle pushed above it, to 4184. Breakout, right?
Now look at where it closed. Back under the line.
A wick above, but a close back inside. That is a fake breakout.
Buyers pushed it up, but they could not hold it. Gold then fell to 4066.
A real breakout looks different. Check two things.
One. The candle body closes beyond the level, not just the wick.
Two. The next candle holds above it, and does not fall back in.
So the rule is simple. Wait for the close, not the wick.
Closed back inside? Don't buy. Some traders sell it instead, with a stop above the wick.
Save this. Wick above, close back inside: fake, don't chase. Close above, next candle holds: real.
Your turn. This silver candle just broke the high. Real, fake, or wait? Comment below.
Follow for one chart lesson every day.
go dot borearis dot com.
Keep watching




AI-voiced; written and reviewed by the Borearis Research Team. For education only, not investment advice. Trading involves risk.