
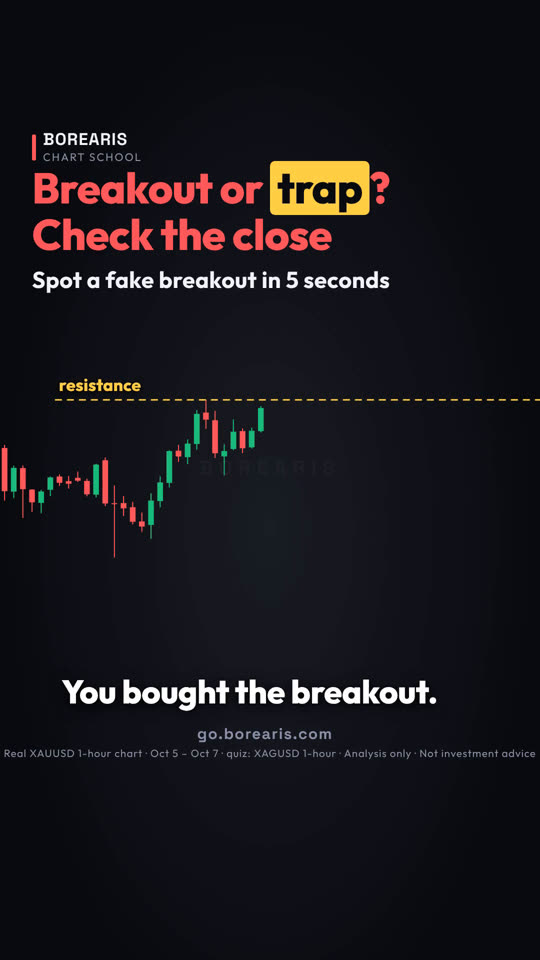

这堂课用的真实 K 线
Real XAUUSD 1-hour chart · Oct 5 – Oct 7 · quiz: XAGUSD 1-hour
视频最后的小测验:这根白银 K 线突破了高点。真的、假的,还是再等?
视频完整旁白(英文原文)
You bought the breakout. Then it dropped right back.
That was a fake breakout. Here's how to spot one before you buy.
Look at this gold chart. The high was around 4180.
Then this candle pushed above it, to 4184. Breakout, right?
Now look at where it closed. Back under the line.
A wick above, but a close back inside. That is a fake breakout.
Buyers pushed it up, but they could not hold it. Gold then fell to 4066.
A real breakout looks different. Check two things.
One. The candle body closes beyond the level, not just the wick.
Two. The next candle holds above it, and does not fall back in.
So the rule is simple. Wait for the close, not the wick.
Closed back inside? Don't buy. Some traders sell it instead, with a stop above the wick.
Save this. Wick above, close back inside: fake, don't chase. Close above, next candle holds: real.
Your turn. This silver candle just broke the high. Real, fake, or wait? Comment below.
Follow for one chart lesson every day.
go dot borearis dot com.
接着看



视频为 AI 配音,内容由 Borearis 研究团队撰写审核。仅供学习参考,不构成投资建议,交易有风险。