
Bitcoin (BTC/USD) Triple bottom 15 min

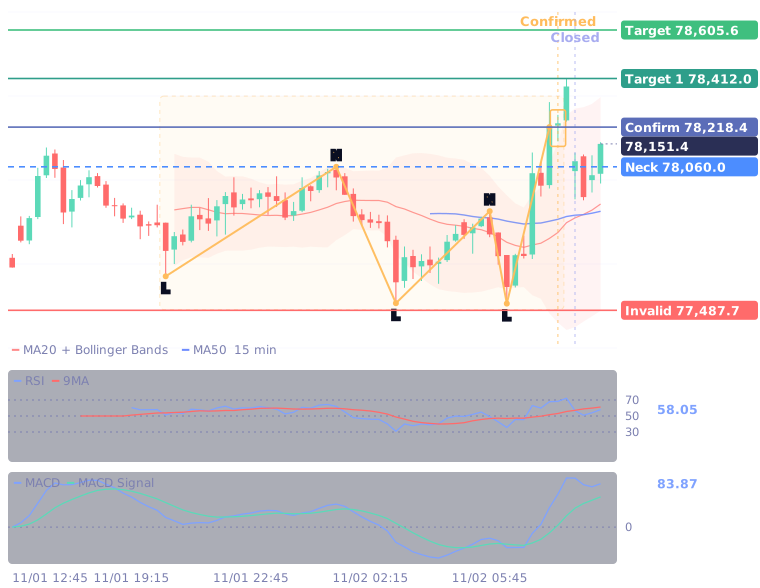
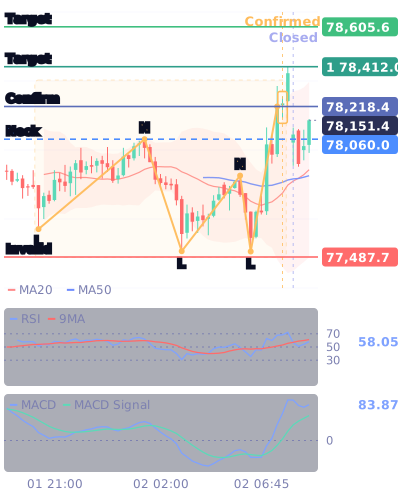
Gold line = the pattern's swing points; gold box = the confirmation candle; coloured lines = target and invalidation; blue = confirmation price.
Triple bottom: First target, then break-even
What this tells you
Price holds the same low three times; a break above the neckline suggests buyers keep defending that level and a base may be in.
← All chart patterns · Other patterns for this market · Key levels and research for this market · How to read patterns
Swing points
| Point | Time UTC+8 | Price |
|---|---|---|
| Low | Nov 01, 20:15 | 77,623.4 |
| Neckline | Nov 02, 01:15 | 78,060.0 |
| Low | Nov 02, 03:00 | 77,516.0 |
| Neckline | Nov 02, 05:45 | 77,883.0 |
| Low | Nov 02, 06:15 | 77,514.4 |
| Confirmation | Nov 02, 07:45 | 78,218.4 |
Recently closed Triple bottom patterns: 5 in total, 4 reached the target first (80%), 1 were invalidated and 0 expired (small sample). Results by pattern →
Chart patterns are technical reference points, not trade recommendations. Past results do not guarantee future outcomes; trading involves risk.
Live levels and price alerts in the app
The Borearis app has live levels for every market, price alerts, daily picks and AI analysis.